Curated OER
Worksheet 18: Combinations & Permutations
In this combinations and permutations worksheet, students list the number of combinations from a given set. They describe and justify the permutations and combinations. This two-page worksheet contains four problems.
Curated OER
Worksheet 16: Plurality
In this plurality worksheet, students study a given set of voting statistical data. They use the plurality method to determine the election results. This two-page worksheet contains four multi-step problems.
Curated OER
Worksheet 14: Condorcet Method
In this Condorcet Method worksheet, students use the Condorcet and Borda Methods to determine the results of given election data. This two-page worksheet contains four multi-step problems.
Curated OER
Worksheet 15: Sequential & Hare Methods
In this Sequential and Hare Method worksheet, students determine the results of elections from given sets of information. They use either the Sequential or Hare Method to determine the outcome. Students justify their answers. This...
Curated OER
Probability and Standard Deviation
In this probability and standard deviation activity, students answer 5 questions derived from one scenario that involving finding percentages.
Curated OER
Scatterplots
In this scatterplots worksheet, students construct a scatter plot from a given data set. Students then answer 4 questions regarding the least-squares regression line and making predictions.
Curated OER
Stemplots
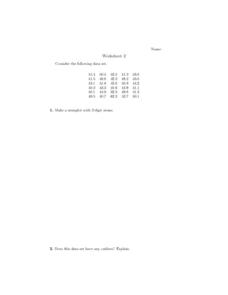
In this stem plot instructional activity, students construct 3 stem plots. Students answer 1 question about outliers and another question regarding which stem plot is preferred.
Curated OER
Statistics
In this statistics learning exercise, 9th graders solve and complete 5 different word problems that include different data. First, they determine if there is an explanatory and a response variable in the given data set. Then, students...
Curated OER
Scatterplots
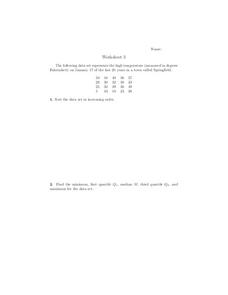
For this scatterplots worksheet, 9th graders solve and complete 6 different word problems with different sets of data. First, they sort the data set in increasing order and find the minimum, first quartile, median, third quartile, and...
Curated OER
Equation of a Line
In this equation of a line worksheet, 9th graders solve and complete 4 different multiple choice problems. First, they use the median fit method to determine the equation that most likely represents the line of best fit for the data...
Curated OER
Statistics
In this statistics worksheet, 9th graders solve and complete 5 various types of problems related to determining statistics. First, they determine the data set where the median value is equal to the mean value. Then, students determine...
Curated OER
Measures of Central Tendency
In this measures of central tendency worksheet, students find the mean, mode and range of given sets of data. They interpret box-and-whisker graphs and stem-and-leaf plots. This two-page worksheet contains eleven multi-step problems.
Curated OER
Penny Toss - Exponential Growth and Decay
In this penny toss activity, students collect statistical data by tossing pennies and then create a scatter plot of the data. They use formulas for exponential growth and decay and then plot the function. This two-page document...
Curated OER
Fruit Loops/Cheerios Activity: Measures of Central Tendency
In this measures of central tendency worksheet, students use Fruit Loops and Cheerios to gather statistical data. They find the mean, mode and median of the data. Students construct a box-and-whisker plot of the class data. This...
Curated OER
Statistics: Quartiles and Percentiles
In this statistics worksheet, learners examine a data set and identify the lower and upper quartiles. They determine percentile ranks of given material and compute the median of the data. This one-page worksheet contains ten problems.
Curated OER
Sample Spaces
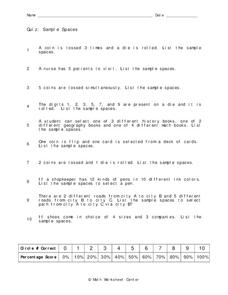
In this sample spaces instructional activity, 9th graders solve 10 different word problems that include sample spaces in each. First, they toss a coin and roll a die listing the sample spaces for each. Then, students flip one coin and...
Curated OER
Isosceles Triangle Theorems
In this isosceles triangle worksheet, students use theorems to determine if given triangles are congruent or not congruent. In addition, they identify the described triangles as isosceles or right. This one-page worksheet contains ten...
Curated OER
Categorizing Data and Bias
In this categorizing data and bias worksheet, 9th graders solve 10 different problems that include various types of qualitative or quantitative data. First, they determine if the problem stated is univariate or bivariate data. Then,...
Curated OER
Stem and Leaf Plots
In this stem and leaf plots worksheet, students solve and complete 10 different problems that include designing stem and leaf plots. First, they use the table on the left to determine the least score and the range of the total scores...
Curated OER
Circle Graphs
In this circle graphs worksheet, students solve 10 different problems that include reading various circle graphs. First, they use graph 1 to determine how many students preferred which sport. Then, students use graph 2 to determine the...
Curated OER
Independent Practice 1: Box and Whisker Plot
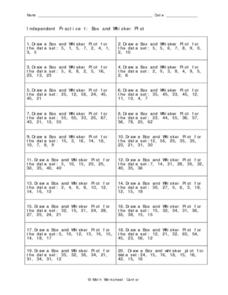
In this box and whisker plot worksheet, students create a box and whisker plot from a given set of data. They identify the lower quartile, upper quartile, the mean, and outliers. This one-page worksheet contains 20 sets of numbers from...
Curated OER
Theoretical and Empirical Probabilities
In this probability worksheet, students determine the theoretical probability of given events. Topics include choosing a card at random, number cubes, and fractions. This one-page worksheet contains ten problems.
Curated OER
Probability as a Decimal
In this probability as a decimal activity, students determine the probability of a number as a decimal. They draw a marble at random from a jar and calculate the probability given. Then, students roll a die numbered from 1 to 6 and...
Curated OER
Complement of an Event
In this probability worksheet, 9th graders solve 10 different problems that complement a particular event. First, they determine the probability of landing on a sector that is not black after spinning the spinner. Then, students...


