Curated OER
Spreadsheet Budget Project
Eighth graders record all the food they eat for one week, compute the costs for all of this food, and display the different categories on a spreadsheet and then convert to a chart.
Curated OER
Country Comparisons in Current Events Class
Learners collect political, socioeconomic, geographical, and other data about 10 countries and record their data in a spreadsheet. The information is used to fuel current events discussions.
Curated OER
Second Star To the Left and Straight On 'Till Morning" - Spreadsheet Driven Exploration of Pacific Asian Geography
Students explore the geography of Pacific Asia. The class is divided into two groups to participate in a role-play activity where they act as European explorers. Students utilize mathematics, spreadsheet and internet technology to make...
Curated OER
Technology Integration Lesson Plan: Civil War Spreadsheet
Eighth graders discuss and analyze Civil War data, manually graph data on handout, work with partners to enter data into spreadsheets, and create charts on spreadsheet for each data set.
Curated OER
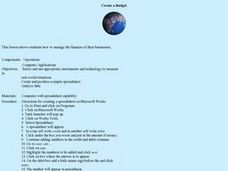
Create a Budget
Learners develop a budget spreadsheet to manage finances for their business. For this finance lesson, students use a spreadsheet program to create a budget with credit and debit columns. There are step-by-step directions for creating a...
Curated OER
A Line Graph of the Ocean Floor
Students develop a spreadsheet and import the information into a line graph. In this spreadsheet and line graph lesson, students develop a spreadsheet of ocean depths. They import the information into a word processed document. They...
Curated OER
State Economy Chart
Fifth graders research and record statistics on the economy of an assigned state. They create a spreadsheet in Excel to report the data and a 3D Pie graph using the Chart Wizard in Excel to represent their states' data.
Curated OER
Calculating Profits from Selling Virtual Lemonade
Students set up and collect data for a virtual lemonade stand. In this entrepreneurship, economics, and technology instructional activity, students purchase ingredients, determine costs, and set up a virtual lemonade stand. Students...
Curated OER
What are they like Today
Sixth graders compare the modern day countries that exist in the areas they study in Ancient History. They use a spreadsheet on the computer to organize data that includes population of the countries, along with other various types of...
Curated OER
Historical Population Changes in the US
Students conduct research on historical population changes in the U.S. They conduct Internet research on the Historical Census Data Browser, create a bar graph and data table using a spreadsheet program, and display and interpret their...
Curated OER
Introduction to Spreadsheets
Sixth graders utilize Excel or other spreadsheet software to create both text and numerical valued columns to produce a Christmas or birthday wish list. They study the difference between text and numerical values for column use and...
Curated OER
Should Voting in the United States be Mandatory? Research Activity
Eighth graders research how many voters actually vote in the U.S. and nine other nations. They create a spreadsheet using this information and write a persuasive essay.
Curated OER
Technobiz
Students examine candy preferences to create a plan in order to improve candy sales. In this technobiz instructional activity, students build spreadsheet and organizational skills by graphing and calculating data. Students are introduced...
Curated OER
What Does George W. Bush Have in Common With Past U.S. Presidents?
Sixth graders discover what it takes to become President of the United States. Using a database, they complete a scavenger hunt to determine what George W. Bush has in common with past Presidents. They also create a spreadsheet which...
Curated OER
European Elevation Sort
Given a prepared database of European countries, sixth graders sort the countries in ascending order by elevation and identify the five countries with the highest elevations. This cross-curricular activity combines elements of computer...
Curated OER
Paying Off Student Loans
Students plan financing postsecondary education and explain how loan repayments work. They build a spreadsheet, listing the categories of expenses in the left hand column.
Curated OER
Influence of Beauty, The Beauty of Influence
Tenth graders explore the influence of art on modern societies. Through the internet, they assess paintings of advertisements for commercial products and social-political beliefs. Using spreadsheet software, the class compares and...
Curated OER
Spreadsheets - WP9/Quattro Pro
Students discover spreadsheet applications using Quattro Pro. They demonstrate basic knowledge and application of hardware, software, and Internet use. They recognize and appreciate the value of recording keeping, data input and data...
Curated OER
A "Capital" Idea
Eighth graders prepare for a field trip to Washington, DC by researching landmark, monument, or building in Washington. They use the information in small groups to design a multimedia presentation. They include a spreadsheet that shows...
Curated OER
Political Issues Survey
Fifth graders develop and conduct a survey regarding issues in a current political campaign. They distribute and collect the surveys, input the data using a spreadsheet program, and compare/contrast the recorded results.
Curated OER
Graphing the Past Using Today's Technology
Eighth graders research statistical data regarding their current social studies unit. They write questions about the measures of central tendency, collect and analyze the data, insert the data into a spreadsheet, and generate graphs.
Curated OER
What's Our Department Budget?
Analyze the influence of culture, media, technology, and other factors on health and examine a hospital budget. Learners will create a budget for a hospital taking in account factors such as staff and departmental needs and necessary...
Curated OER
Supply and Demand
Students define economic terms, list three conditions that must be present in order for demand to exist, define law of supply and demand, differentiate between buyer's and seller's markets, examine concept of elasticity, view tutorial on...
Council for Economic Education
Loan Amortization - Mortgage
When you buy a home for $100,000, you pay $100,000—right? On the list of important things for individuals to understand, the lesson presents the concept of interest rates and loan amortization using spreadsheets and online sources....
Other popular searches
- Spreadsheets
- Excel Spreadsheets
- Budget Spreadsheet
- Favorite Foods Spreadsheet
- Microsoft Excel Spreadsheets
- Candy Wrapper Spreadsheet
- Basic Spreadsheet Skills
- Spreadsheet Lesson Plans
- Meteorology and Spreadsheets
- Using Excel Spreadsheets
- Amusement Park Spreadsheet
- Creating a Spreadsheet


