Curated OER
Literary Skills
Develop their literary skills. In this literature lesson plan, students collaborate to read portions of books and examine settings, plots, main ideas, and conclusions.
Curated OER
Integrated Algebra Practice: Histograms
In this histogram worksheet, students solve 6 multiple choice and short answer problems. Students read histograms and determine the frequency of a particular item.
Curated OER
Of Mice And Men: Chapter 2 Reading And Study Guide
In this comprehension check worksheet, students define 5 vocabulary words, define 5 literary terms, and respond to 16 short answer questions pertaining to chapter 2 of Steinbeck's Of Mice and Men in order to help them better understand...
Curated OER
Data Analysis Self-Test
In this data analysis worksheet, students complete 1 problem that has 7 parts involving mean, median, mode, range, and quartiles. Students then perform 5 operations with matrices.
Curated OER
High School Mathematics Problems from Alaska: Investigation of Herring Statistics
Pupils read complex charts, find measures of central tendency, calculate large numbers, create histograms and box plots. They answer questions using the "Fisherman's Copy" of statistics.
Curated OER
Exploring Data Sets and Statistics in Baseball
Learners explore the concept data sets. In this data sets lesson plan, students find the 5 number summaries for salaries of teachers and compare them with 5 number summaries of professional baseball players. Learners use box...
Curated OER
Super Bowl Champs
For this Super Bowl worksheet, students create line plots of all winners and losers of the Super Bowl. They create stem-and-leaf plots, scatter plots, and bar graphs of football data. This one-page worksheet...
CCSS Math Activities
Smarter Balanced Sample Items: High School Math – Claim 4
What is the appropriate model? Sample problems show the extent of the Smarter Balanced assessments Claim 4, Modeling and Data Analysis. Items provide pupils the opportunity to use mathematical modeling to arrive at a reasonable answer....
Inside Mathematics
Suzi's Company
The mean might not always be the best representation of the average. The assessment task has individuals determine the measures of center for the salaries of a company. They determine which of the three would be the best representation...
Fort Bend Independent School District
Data Analysis - AP Statistics
What better way to study survey design than to design your own survey! Bring a versatile data analysis project to your AP Statistics class, and encourage them to apply the practices from their instructions to a real-world survey...
CCSS Math Activities
Smarter Balanced Sample Items: High School Math – Claim 2
Problem solve across the content standards. The presentation slides provide 19 sample items from the Smarter Balanced high school assessment. Items illustrate Claim 2, problem solving, of the test and are drawn from all the high school...
Mathematics Assessment Project
College and Career Readiness Mathematics Test C2
Scholars apply knowledge learned over their high school math courses in order to determine their college readiness. The 20-page resource emphasizes applied problem solving.
Georgia Department of Education
The Basketball Star
Have learners use math to prove they are sports stars! Assess a pupil's ability to create and analyze data using a variety of graphs. The class will be motivated by the association of math and basketball data.
Curated OER
Statistics with State Names
Students analyze the number of times each letter in the alphabet is used in the names of the states. In this statistics instructional activity, students create a stem and leaf plot, box and whisker plot and a histogram to analyze their...
Curated OER
TEXT MESSAGING
Students examine the differences between standard and non-standard English and use text-speak to rewrite a plot summary and a news story. They identify a type of non-standard English and determine the characteristics that make it...
Curated OER
Teaching Radioactive Decay: Radioactive Half-life And Dating Techniques
High schoolers generate a radioactive decay table for an imaginary element using a box filled with pinto beans and M&M's. They use their data to plot a decay graph, develop the concept of half-life, and use the graph to "age" several...
Curated OER
Sequence Investigation
Eleventh graders investigate arithmetic sequences. In this Algebra II lesson, 11th graders create an arithmetic sequence and explore the effect of each variable in the formula of the nth term of an arithmetic sequence. ...
Curated OER
Our Neighborhood in the Milky Way
In this Milky Way galaxy worksheet, young scholars are given a table of distances and angles of nebulae and star clusters from the sun. Students plot each one on a piece of paper and solve 2 problems using the data.
Curated OER
Campus Habitat Improvement Plan
Students work to improve a plot of land. They assess the needs of the environment and formulate a plan. They plant trees and gardens, build bird boxes, construct waterholes. etc.
Curated OER
Wavelength And Resolution
High schoolers perform a simulation of the workings of an electron microscope to discover that the resolution will need to improved to detect objects in the nano-scale. They use wooden dowels as detectors to determine the shape of...
CCSS Math Activities
Smarter Balanced Sample Items: High School Math – Target P
Learn how to show data in varied ways. A PowerPoint presentation provides six questions from the high school SBAC Claim 1 Target P item specifications. It covers creating data representations, interpreting and comparing data, and...
Radford University
Danger! – An Analysis of the Death Toll of Natural Disasters
Decipher the danger of natural disasters. Using researched data, scholars work in groups to create data displays on the number of deaths from different types of natural disasters. They share their graphical representations with the class...
American Museum of Natural History
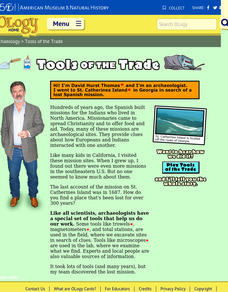
Tools of the Trade
Archaeologist David Hurst Thomas details his search for a lost Spanish Mission on St. Catherines Island, Georgia. A great way to introduce youngsters to the life of and the tools used by archaeologists.
National Council of Teachers of Mathematics
Eruptions: Old Faithful Geyser
How long do we have to wait? Given several days of times between eruptions of Old Faithful, learners create a graphical representation for two days. Groups combine their data to determine an appropriate wait time between eruptions.
Other popular searches
- Analyzing Box Plots
- Outliers Box Plots
- Interpret Box Plots
- Graphs Box Plots
- Analysing Box Plots
- Leaf Box Plots
- Statistics Box Plots
- Conclude Box Plots
- Box Plots Worksheets
- Double Box and Whisker Plots
- Scatterplot Box


