Radford University
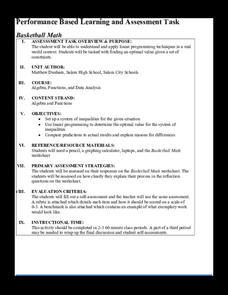
Basketball Math
Shoot for a better knowledge of optimization strategies. During the first part of the task, scholars use given basketball shooting percentages for different players to predict the winner by examining systems of inequalities. For the...
Radford University
How do I Create a Scaled Model of a Full-Sized Basketball Court?
Take mathematics to the hoop! Pairs first measure the linear distances on a basketball court. Using those measurements, they determine the scale lengths to create a scaled model. To finish the activity, learners create models of the...
Radford University
Modeling Quadratics Basketball Video Project
Will he make it? After watching a video of part of a basketball shot, groups create their own videos. Teams record a video of shooting a ball at a hoop and edit it to show only a portion of the shot. Group members determine the equation...
Mathalicious
Three Shots
To foul or not to foul, that is the basketball question. High schoolers look at the probability that fouling out a player and allowing free throws yields a better outcome than allowing the original shot. The resource provides a teacher's...
Curated OER
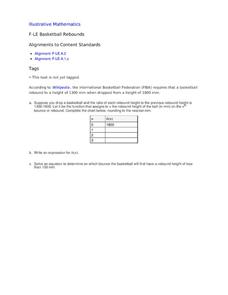
Basketball Rebounds
Your young basketball players will build a table and develop a general formula for a decaying exponential scenario involving the rebound distance of a bouncing ball. Using a CBR and graphing calculator can make this even more hands-on...
Curated OER
Basketball Bounces, Assessment Variation 2
This un-scaffold summative assessment tasks learners to use the height of a bouncing basketball, given the data in graph and table form, to choose the model that is represented. Learners then use the model to answer questions about the...
Curated OER
Basketball Bounces, Assessment Variation 1
This highly scaffolded, summative assessment tasks learners to choose the model that represents the height of a bouncing basketball given the data in graph and table form. Learners then use the model to answer questions about the...
Curated OER
College Athletes
When more basketball players are taller than field hockey players at a school, is it safe to say that in general they are always taller? The activity takes data from two college teams and your learners will be able to answer questions...
Illustrative Mathematics
3-D Shape Sort
From the apple on your desk and the coffee cup in your hand, to the cabinets along the classroom wall, basic three-dimensional shapes are found everywhere in the world around us. Introduce young mathematicians to the these common figures...
EngageNY
Conducting a Simulation to Estimate the Probability of an Event II
Add some randomization into simulations. The 11th installment in a series of 25 presents two new methods to use in simulations--colored disks, and random numbers. Pupils use random numbers to run simulations where the probabilities make...
Radford University
Regression Analysis Activity
Don't let your knowledge of regression analysis regress. Pupils take part in three activities to learn about regression curves. They research and collect data to predict how long it will take a basketball to hit the ground, find a...
EngageNY
Linear Equations in Two Variables
Create tables of solutions of linear equations. A lesson has pupils determine solutions for two-variable equations using tables. The class members graph the points on a coordinate graph.
EngageNY
Describing a Distribution Displayed in a Histogram
The shape of the histogram is also relative. Learners calculate relative frequencies from frequency tables and create relative frequency histograms. The scholars compare the histograms made from frequencies to those made from relative...
EngageNY
Introduction to Simultaneous Equations
Create an understanding of solving problems that require more than one equation. The lesson introduces the concept of systems of linear equations by using a familiar situation of constant rate problems. Pupils compare the graphs of...
EngageNY
Creating a Histogram
Display data over a larger interval. The fourth segment in a 22-part unit introduces histograms and plotting data within intervals to the class. Pupils create frequency tables with predefined intervals to build histograms. They describe...
Virginia Department of Education
z-Scores
Just how far away from the mean is the data point? Pupils calculate the standard deviation for a set of data and find out how many standard deviations a point is away from the mean. The teacher leads a discussion on how to calculate...
NTTI
What Size Is It Anyway?
A fabulous plan on teaching basic concepts of measurement to young learners. Pupils use nonstandard units to measure length, practice using a ruler and a yardstick, compare the length of two objects, and perform estimations of length....
West Contra Costa Unified School District
Comparing Data Displays
There is so much more to data than just numbers, and this resource has learners use three methods of comparing data in a multi-faceted lesson. The 21-page packet includes a warm-up, examples, an activity, and assessment for a complete...
Curated OER
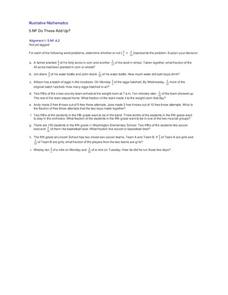
Do These Add Up?
Common Core mathematical practices require that young mathematicians not only know how to add fractions with unlike denominators, but also to recognize when adding fractions are appropriate for the word problem. Fifth graders are given...
Curated OER
One-Variable Inequality Word Problems
Here is a great set of eight scenarios that require the writing of a one-variable inequality and then solving to find the solution. This inequality word problem activity is then followed by the solutions to each of the eight problems.
Region of Peel
Put Me in Order
Sorting fractions, integers, decimals and square roots into sequential order is an active process when you use a gym as your setting. After your class is divided into two groups and provided with number cards, they compete to see who can...
Teach Engineering
The Great Gravity Escape
Groups simulate an orbit using a piece of string and a water balloon. Individuals spin in a circular path and calculate the balloon's velocity when the clothes pin can no longer hold onto the balloon.
Scholastic
Extension Activity Building a Healthy Classroom Community
Workout buddies aren't just for adults! Learners discuss the benefits of 60 minutes of physical activity each day and generate ideas for how they can accomplish this by working toward a goal with friends.
Other popular searches
- Basketball Math Lessons
- Basketball Math Games
- Basketball Math Fun
- Basketball Math Activities
- Fantasy Basketball Math
- Basketball Math Lessons Area
- Basketball Math Addition
- Ncaa Basketball Math
- Basketball Math Lesson Plans
- Math and Basketball
- Basketball Math Dribbling
- Math Basketball


