Curated OER
In the Billions and Linear Modeling
Your learners analyze population data to discern if it best fits a linear scenario. The idea of change by equal differences over equal intervals is enforced in this real-life task.
Curated OER
Describing Data
Your learners will practice many ways of describing data using coordinate algebra in this unit written to address many Common Core State Standards. Simple examples of different ways to organize data are shared and then practice problems...
Curated OER
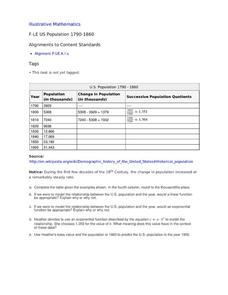
US Population 1790-1860
Your young population scientists analyze a table of values, write a model to represent the real life data, finish the table of data and predict future populations in a collaborative, real-life activity.
Curated OER
Linear or Exponential?
Your learners analyze various real-life contexts to decide if each is a linear or exponential model. This could be used as an assessment of learners' skills of discerning between a linear and an exponential model.
Curated OER
US Population 1982-1988
Your algebra learners make predictions using the concepts of a linear model from real-life data given in table form. Learners analyze and discuss solutions without having to write a linear equation.
EngageNY
Exploiting the Connection to Cartesian Coordinates
Multiplication in polar form is nice and neat—that is not the case for coordinate representation. Multiplication by a complex number results in a dilation and a rotation in the plane. The formulas to show the dilation and rotation are...
Curated OER
Sandia Aerial Tram
Your learners analyze a table of real-life data in order to write an equation that best models the information. Exponential, quadratic, and linear rates of changes are all possibilities in this task.
Mathematics Vision Project
Similarity and Right Triangle Trigonometry
Starting with similar triangles and dilation factors, this unit quickly and thoroughly progresses into the world of right triangle features and trigonometric relationships. Presented in easy-to-attack modules with copious application...
National Security Agency
Systems of Equations and Inequalities
High school classes can use manipulatives too! Offer hands-on, interactive lessons that venture away from the typical day in your algebra class. Young mathematicians will be involved in collaborative learning, visual representations, and...
Curated OER
Stochastic and Deterministic Modeling
Explore the difference between stochastic and deterministic modeling through programming. First have the class write algorithms for relatively simple tasks using pseudocode. Use the Python 2.7 program app to simulate Mendel's Pea Pod...
Illustrative Mathematics
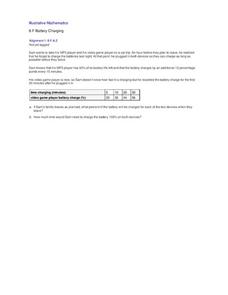
Battery Charging
Your class will be very interested in the results of this activity. How long does it take a MP3 and video game player to charge? Sam only has an hour and the MP3 player only has 40% of its battery life left. Plus, his video player is...
Curated OER
Basketball Bounces, Assessment Variation 1
This highly scaffolded, summative assessment tasks learners to choose the model that represents the height of a bouncing basketball given the data in graph and table form. Learners then use the model to answer questions about the...
Houston Area Calculus Teachers
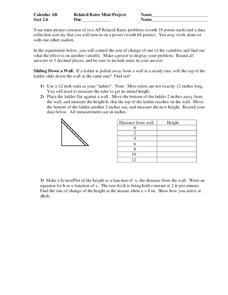
Related Rates
Use a hands-on approach to exploring the concepts of related rates in your AP Calculus class. Individuals explore the effect of the rate of change on a variable related to a variable they control. After analyzing the data they collect,...
Georgetown University
Cup-Activity: Writing Equations From Data
Determine how cup stacking relates to linear equations. Pupils stack cups and record the heights. Using the data collected, learners develop a linear equation that models the height. The scholars then interpret the slope and the...
American Statistical Association
How Random Is the iPod’s Shuffle?
Shuffle the resource into your lesson plan repertoire. Scholars use randomly-generated iPod Shuffle playlists to develop ideas about randomness. They use a new set of playlists to confirm their ideas, and then decide whether the iPod...
EngageNY
Modeling Relationships with a Line
What linear equation will fit this data, and how close is it? Through discussion and partner work, young mathematicians learn the procedure to determine a regression line in order to make predictions from the data.
EngageNY
Properties of Area
What properties does area possess? Solidify the area properties that pupils learned in previous years. Groups investigate the five properties using four problems, which then provide the basis for a class discussion.
EngageNY
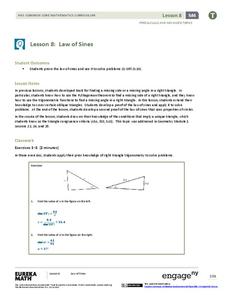
Law of Sines
Prove the Law of Sines two ways. The ninth segment in a series of 16 introduces the Law of Sines to help the class find lengths of sides in oblique triangles. Pupils develop a proof of the Law of Sines by drawing an altitude and a second...
Alabama Learning Exchange
Bloodstain Pattern Doesn't Lie......
An interesting instructional activity on hypothesizing about the diameter of a drop of blood that is splattered. To test their theories, learners work in groups to make blood droplets splatter from different heights. They use graphed...
American Library Association
Even and Odd Numbers: Lesson Plans and Sample Problems
If your youngsters are new to numbers, here are several interactive strategies to get them thinking about even and odd numbers. For example, they can count the number of desks, people, etc. in the room and determine if it is even or odd....
American Statistical Association
How Tall and How Many?
Is there a relationship between height and the number of siblings? Classmates collect data on their heights and numbers of brothers and sisters. They apply statistical methods to determine if such a relationship exists.
Curated OER
Representing Data 1: Using Frequency Graphs
Here is a activity that focuses on the use of frequency graphs to identify a range of measures and makes sense of data in a real-world context as well as constructing frequency graphs given information about the mean, median, and range...
Shodor Education Foundation
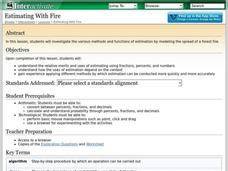
Estimating With Fire
Watch the damage from a forest fire in this interactive simulation activity that challenges learners to estimate the burn area using different approaches. Learners are given a worksheet to track the different burn patterns and practice...
Curated OER
Forms of Exponential Expressions
Your young physicists analyze the forms of four equivalent exponential expressions representing an amount of a radioactive material in a substance. They show how each expression is equivalent to the others and what aspects of the decay...
Other popular searches
- Math Functions Quadratic
- Math Functions Domain Range
- In/out Math Functions
- Math Functions and Patterns
- Math Functions Egg Carton
- Math Functions Spaghetti
- Math Functions Bridge
- Math Functions Rounding
- Composite of Math Functions
- Math Functions Quadractic
- Functions Math
- Linear Functions Math Models


