EngageNY
Connecting Graphical Representations and Numerical Summaries
Which graph belongs to which summary statistics? Class members build upon their knowledge of data displays and numerical summaries to connect the two. Pupils make connections between different graphical displays of the same data in the...
Resources for Early Childhood
Making Math Meaningful and Enjoyable
Your young learners will enjoy mathematics that is meaningful correspondence as they play their way to a deep mathematical foundation. Organized around the math standards, this appropriate sequence of conceptual, preschool...
Illustrative Mathematics
Doubling Numerators and Denominators
Understanding the meaning of fractions is a challenge for many young learners. These two questions examine what happens when the numerator and denominator of a fraction are doubled. Consider allowing students to discuss their ideas in...
EngageNY
Relationships Between Two Numerical Variables
Working in small groups and in pairs, classmates build an understanding of what types of relationships can be used to model individual scatter plots. The nonlinear scatter plots in this instructional activity on relationships between two...
EduGAINs
Making Savvy Consumer Choices
It's never too early to learn about grocery budgeting. Middle schoolers delve into the world of consumer math with a activity that focuses on both healthy choices and real-world math applications. Groups work together to form a grocery...
Rational Number Project
Initial Fraction Ideas Lesson 9 Overview
Visual models support young mathematicians with exploring equivalent fractions. Starting with a quick warm-up problem, children go on to work through a series of guiding practice problems before working with a partner identifying and...
EngageNY
Posing Statistical Questions
Is this a statistical question? The opening lesson in a series of 22 introduces the concept of statistical questions. Class members discuss different questions and determine whether they are statistical or not, then they sort the data...
EngageNY
Complex Number Division 2
Individuals learn to divide and conquer complex numbers with a little help from moduli and conjugates. In the second instructional activity on complex number division, the class takes a closer look at the numerator and denominator of the...
School District of Palm Beach County
Egyptian Hieroglyphs
Humans have been developing number systems for thousands of years, and while they can be very different from one another, they can also share surprising similarities. Take your young mathematicians on a journey through the history of...
EngageNY
Relationships Between Two Numerical Variables
Is there another way to view whether the data is linear or not? Class members work alone and in pairs to create scatter plots in order to determine whether there is a linear pattern or not. The exit ticket provides a quick way to...
EngageNY
Part of a Whole as a Percent
Pupils use visual models, numeric methods, and equations to solve percent problems. To complete the second installment of 20, they find the part given the percent and the whole, find the percent given the part and the whole, and find the...
EngageNY
Conversion Between Celsius and Fahrenheit
Develop a formula based upon numerical computations. The 31st part of a 33-part unit has the class determine the formula to convert a temperature in Celsius to a temperature in Fahrenheit. They do this by making comparisons between the...
EngageNY
The Slope of a Non-Vertical Line
This lesson introduces the idea of slope and defines it as a numerical measurement of the steepness of a line. Pupils then use the definition to compare lines, find positive and negative slopes, and notice their definition holds for...
EngageNY
Understanding Box Plots
Scholars apply the concepts of box plots and dot plots to summarize and describe data distributions. They use the data displays to compare sets of data and determine numerical summaries.
EngageNY
Summarizing a Data Distribution by Describing Center, Variability, and Shape
Put those numbers to work by completing a statistical study! Pupils finish the last two steps in a statistical study by summarizing data with displays and numerical summaries. Individuals use the summaries to answer the statistical...
Utah Education Network (UEN)
Finding Slope of a Line from Graphs, Tables, and Ordered Pairs
Middle schoolers explore the concept of slope in numerous ways and start to look at simple linear equations. They describe the slope in a variety of ways such as the steepness of a line, developing a ratio, using graphs, using similar...
Curated OER
Interpreting Algebraic Expressions
Interpreting algebraic expressions is a fundamental skill in beginning algebra. This lesson approaches the task in numerous ways. First, learners assess their understanding with a short worksheet on converting between words and...
Rational Number Project
Initial Fraction Ideas Lesson 18: Overview
Develop young mathematicians' ability to compare fractions with investigation into the number 1/2. After brainstorming a list of fractions equivalent to 1/2, children identify a pattern in the numerators and denominators that allows them...
National Security Agency
Multiple Representations of Limits
After an introductory activity to demonstrate the theory of a limit, additional activities approach a limit from graphical, numerical, and algebraic methods. The activity looks at the multiple ways of understanding and evaluating a limit.
Illustrative Mathematics
Teen Go Fish
Kindergartners play the classic game Go Fish as they practice identifying numbers in the teens. A fun and engaging activity that develops number recognition skills in young learners. As added support, provide cards that include both the...
Virginia Department of Education
Adding and Subtracting Fractions
Your learners will enjoy playing a game as a motivator to learning and remembering the adding and subtracting of fractions.
Curated OER
Quinoa Pasta 3
A mixture of quinoa and corn is for dinner in this collaborative task that sets up nicely as a system of linear equations. Your supper guests discuss numerical precision and percentages as they formulate a plan of how to solve the problem.
Curated OER
The Canoe Trip, Variation 2
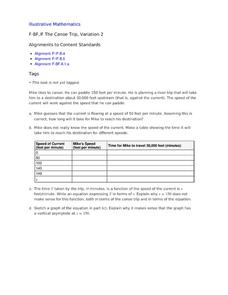
The behavior of a rational function near a vertical asymptote is the focus around this trip up a river. Specifically, numerical and graphical understanding is studied. The canoe context pushes the variables as numbers, rather than as...
Illustrative Mathematics
Games at Recess
A great non-calculation problem that lets your math minds explore without the pressure of the right answer. Your learners will have to compare boys and girls playing soccer and jump rope during recess. How many more boys than girls are...


