August House
Anansi Goes To Lunch - First Grade
Greed is the theme of this collection of multidisciplinary activities. As a class, read The West African folktale, Anansi Goes to Lunch by Bobby Norfolk, and take part in a grand discussion about it's plot and theme. Reinforce the theme...
Curriculum Corner
Guest Teacher Plans: Grade 6
Taking a day off of school can feel like a lot more work than going because of the time and effort that goes into making sub plans. Make your life easier with a daily plan for a guest teacher designed to meet the needs of sixth graders...
West Contra Costa Unified School District
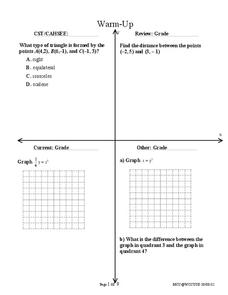
Conics Introduction and Parabolas
Where did conic sections get their name? The equation and graph of a parabola are developed from the definition of the conic section. Teacher examples on graphing the equation and writing an equation from the graph round out the plan.
EngageNY
Analyzing a Graph
Collaborative groups utilize their knowledge of parent functions and transformations to determine the equations associated with graphs. The graph is then related to the scenario it represents.
EngageNY
Interpreting Division of a Whole Number by a Fraction—Visual Models
Connect division with multiplication through the use of models. Groups solve problems involving the division of a whole number by a fraction using models. The groups share their methods along with the corresponding division and...
EngageNY
Creating a Dot Plot
Which dot am I? Pupils create dot plots to represent sample data through the use of frequency tables. The third segment in a series of 22 asks individuals to analyze the dot plots they created. The scholars translate back and forth...
EngageNY
Estimating Centers and Interpreting the Mean as a Balance Point
How do you balance a set of data? Using a ruler and some coins, learners determine whether the balance point is always in the middle. Through class and small group discussions, they find that the mean is the the best estimate of the...
EngageNY
Graphs Can Solve Equations Too
There are many equations Algebra I students are not ready to solve. Graphing to solve gives them a strategy to use when they are unsure of an algebraic approach to solve the problem. The lesson plan exposes learners to a wide variety of...
Curated OER
Cantor Set
Discover an interesting mathematical object that your algebra learners will enjoy investigating. Their adventure will lead them to the generation of a finite geometric series.
EngageNY
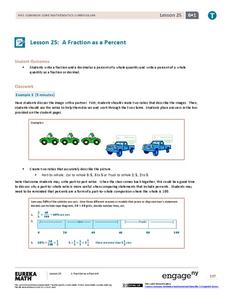
A Fraction as a Percent
It is all about being equivalent. Class members convert between fractions, decimals, and percents. By using visual models, scholars verify their conversions in the 25th portion of a 29-part series.
Statistics Education Web
Consuming Cola
Caffeine affects your heart rate — or does it? Learners study experimental design while conducting their own experiment. They collect heart rate data after drinking a caffeinated beverage, create a box plot, and draw conclusions. They...
Statistics Education Web
Who Sends the Most Text Messages?
The way you use statistics can tell different stories about the same set of data. Here, learners use sets of data to determine which person sends the most text messages. They use random sampling to collect their data and calculate a...
Curated OER
Tiles, Blocks, Sapphires & Gold: Designing a Treasure Map
Young cartographers in groups hide treasure at school and then create a map to find it using pattern blocks and tiles. They make paintings with clues to create a visual representation of the location of their treasure. Groups present...
EngageNY
Understanding Variability When Estimating a Population Proportion
Estimate the proportion in a population using sampling. The 20th installment in a series of 25 introduces how to determine proportions of categorical data within a population. Groups take random samples from a bag of cubes to determine...
EngageNY
Interpreting Division of a Fraction by a Whole Number—Visual Models
Divide fractions just like a model does. Pupils visualize the division of a fraction by a whole number by creating models. Scholars make the connection between dividing by a whole number and multiplication before practicing the skill...
Mixing In Math
Mixing in Math: Growing Plants
Whether you have your class plant seeds or begin when sprouts are visible, math skills are used here to predict and track growth over time. Straw bar graphs show plant height on a given day while the graph as a whole shows changes over...
Scientific American
Life-Sized Drawing
Ocean explorers or mathematicians research the wreck of the CSS H.L. Hunley. They investigate the actual dimensions of the Hunley using math and measuring skills. Afterward, they sketch a large scale drawing of the submarine outdoors on...
Mathalicious
Domino Effect
Carryout the lesson to determine the cost of pizza toppings from a Domino's Pizza® website while creating a linear model. Learners look through real data—and even create their own pizza—to determine the cost of each topping. They explore...
Curated OER
Taxi!
Your young taxi drivers evaluate and articulate the reasoning behind statements in a conceptual task involving linear data. The given data table of distances traveled and the resulting fare in dollars is used by learners to explore...
Curated OER
Why Does ASA Work?
Your geometry learners explore Angle-Side-Angle congruence in this collaborative task. The sum of the interior angles of all triangles being one hundred eighty degrees, is the key learners will discover as they explain their reasoning...
Curated OER
Solution Sets
Here is a task that gives the graph of the solutions of a system of linear inequalities and asks learners to analyze and write the algebraic form of the systems. By turning the problem around, learners make the connections between...
Curated OER
US Households
Learners construct and use inverse functions to model a real-world context. They use the inverse function to interpolate a data point.
EngageNY
Complex Numbers as Vectors
Show your math class how to use vectors in adding complex numbers. Vectors represent complex numbers as opposed to points in the coordinate plane. The class uses the geometric representation to add and subtract complex numbers and...
Illustrative Mathematics
How Long
It won't take young mathematicians long to learn how to measure length with this fun, hands-on activity. Working in pairs, children use Unifix® or snap cubes to measure and record the lengths of different classroom objects. To extend the...
Other popular searches
- Fractions on a Number Line
- Fractions Number Lines
- Integer Number Line
- Grade One Linear Measurement
- Rounding With Number Lines
- Double Number Lines
- Number Line Addition
- Fraction Number Lines
- Decimals on a Number Line
- Intersection of Two Lines
- Number Line Graphs
- Two Step Linear Equations


