Curated OER
Ornithology and Real World Science
Double click that mouse because you just found an amazing lesson plan! This cross-curricular Ornithology lesson plan incorporates literature, writing, reading informational text, data collection, scientific inquiry, Internet research,...
Curated OER
Data! Data! Graph that Data!
Fifth graders create data graphs using Microsoft Excel. In this data collection lesson, 5th graders create and conduct a survey, then use Excel to organize and graph their data.
Curated OER
Twelve Days of Christmas--Prediction, Estimation, Addition, Table and Chart
Scholars explore graphing. They will listen to and sing "The Twelve Days of Christmas" and estimate how many gifts were mentioned in the song. Then complete a data chart representing each gift given in the song. They also construct...
Curated OER
Tables, Charts and Graphs
Learners examine a science journal to develop an understanding of graphs in science. For this data analysis lesson, students read an article from the Natural Inquirer and discuss the meaning of the included graph. Learners...
Curated OER
Organizing Data Using Tables and Graphs
Students create graphs and tables, as well as interpret and make inferences from the data shown to determine when and where graphs and tables are most useful.
Curated OER
Bias in Statistics
Students work to develop surveys and collect data. They display the data using circle graphs, histograms, box and whisker plots, and scatter plots. Students use multimedia tools to develop a visual presentation to display their data.
Curated OER
Data Analysis Digital Display
Young scholars create a survey online. For this math lesson, students graph survey data using flisti.com. They share and analyze their classmates' histogram.
Curated OER
Bird Feeding and Migration Observation
Students research bird migration and build a bird house. In this bird lesson plan, students research the birds in their area and where they migrate to. They also build their own bird house and record data on what kinds of birds come to...
Curated OER
Graphing Family Reading Habits
Second graders collect data from their families about their reading habits and graph them. In this graphing family reading habits instructional activity, 2nd graders interview family members about their reading habits. They then use a...
Curated OER
Which Car Should I Buy?
Students use gas mileage of different cars to create T charts, algebraic equations, and graphs to show which gets better mileage. In this gas mileage lesson plan, students use the graph to see which car they should buy.
Curated OER
Exploring Renewable Energy Through Graphs and Statistics
Ninth graders identify different sources of renewable and nonrenewable energy. In this math lesson, learners calculate their own carbon footprint based on the carbon dioxide they create daily. They use statistics to analyze data on power...
Curated OER
Hurricane Frequency and Intensity
High schoolers examine hurricanes. In this web-based meteorology instructional activity, students study the relationship between ocean temperature and hurricane intensity. They differentiate between intensity and frequency of hurricanes.
Curated OER
Nutrition and Food Security
Examine the three basic nutrients and their effects on the body. Fifth graders will research data to construct a bar graph and then demonstrate the relationship between malnutrition and food security. This is a very comprehensive...
Curated OER
A Research Project and Article For the Natural Inquirer
Get your class to use the scientific process to solve a scientific problem. They utilize the Natural Inquirer magazine to identify a research question which they write an introduction to and collect data to answer. They use graphs,...
Curated OER
Graph and Compare the Adventure's Temperature Vs. Local Temperature
Students explore the concept graphing data. For this graphing data lesson, students use weather data from their local weather and some other city and graph them. Students plot the local weather vs. another city. Students record...
Curated OER
When Ants Fly
Here is a great instructional activity on constructing line graphs. Learners identify common characteristics of birds, ants common needs of all living things. They also write a story from the perspective of an ant or a bird that has lost...
Curated OER
Graphing Favorite Fruit
Third graders take poll and sort data, enter the data to create a spreadsheet and create bar and pie graphs.
Curated OER
Fruit Loop Graphing
Fifth graders interpret data and create graphs. Given Fruit Loops, they sort and classify according to color. Using spreadsheet technology, 5th graders record their data and create bar and circle graphs. Students analyze data and...
Curated OER
What's the Fizz Factor
Students as a class create a fountain using both coke soda, and mentos candy. In this science lesson, students test which combination of coke and mentos products produce the tallest fountain. Students use the scientific method to track...
Beyond Benign
Water Bottle Unit
How much plastic do manufacturers use to create water bottles each year? The class explores the number of water bottles used throughout the years to determine how many consumers will use in the future. Class members compare different...
Achieve
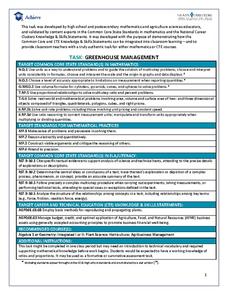
Greenhouse Management
Who knew running a greenhouse required so much math? Amaze future mathematicians and farmers with the amount of unit conversions, ratio and proportional reasoning, and geometric applications involved by having them complete the...
Curated OER
Virtual Field Trip
This hands-on resource has future trip planners analyze graphs of mileage, gasoline costs, and travel time on different routes. While this was originally designed for a problem-solving exercise using a Michigan map, it could be used as a...
Curated OER
Virtual Field Trip
Are we there yet? Young trip planners learn about their state and plan a trip. They will select sites to see in three cities in their state, and record associated costs in a spreadsheet. While this was originally designed as a...
Curated OER
Poetic Math Greeting Cards
Fourth graders work in groups; collect data in a survey; depict in tables, charts, or graphs the results of the survey; and make predictions. They use creative writing skills and computer skills to generate a greeting card of their own.


