Curated OER
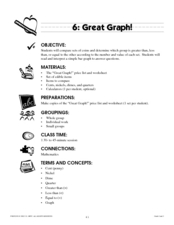
Great Graph!
Here is a fantastic lesson counting coins, interpreting graphs, and the concept of "greater than" and "less than." Young mathematicians utilize worksheets embedded in the plan in order to practice these concepts. The worksheets are...
Curated OER
Computer Graphing Calculator Explorations
Pupils explore the graphing calculator feature on the Macintosh computer to explore some "parent" functions and their translations, combinations, and composites.
Curated OER
Exploring Renewable Energy Through Graphs and Statistics
Ninth graders identify different sources of renewable and nonrenewable energy. In this math lesson, learners calculate their own carbon footprint based on the carbon dioxide they create daily. They use statistics to analyze data on power...
Curated OER
Drive the Data Derby
Three days of race car design and driving through the classroom while guessing probability could be a third graders dream. Learn to record car speed, distances traveled, and statistics by using calculation ranges using the mean, median,...
Curated OER
Build A Skittles Graph
Students explore graphing. In this graphing lesson, students sort Skittles candies and use the color groups to create a bar graph. Rubrics and extension activities are provided.
Curated OER
Watermelon Graphing
Students discover bar graphs. In this primary math lesson plan, students identify the parts of watermelon seeds and other seeds. Students learn the proper names and common names which refer to the parts of the seeds as they create a bar...
Curated OER
Walk-A-Thon
Students graph linear http://www.lessonplanet.com/review?id=180542equations. For this problem solving lesson, students calculate slope and plot ordered pairs on a coordinate grid. Using a real-life example of a walk-a-thon, students...
Curated OER
Build a Skittles Graph
Students construct a bar graph with a given set of data. They calculate the ratio and percent of the data. Students discuss alternate ways of graphing the data as well as multiple strategies to approach the task.
PBL Pathways
Death Project
Verify the rule of thumb for finding the time of death. The project-based learning task asks pupils to determine when the rule of thumb process of finding the time of death is appropriate. Learners develop a function for the rule and...
Teachers Network
A World of Symmetry: Math-Geometry
Define and identify the three basic forms of symmetry translation, rotation, and glides with your class. They cut out and arrange paper pattern blocks to illustrate symmetry, create a Cartesian graph, and design a rug with a symmetrical...
Curated OER
Math Can Be Electrifying
Students explore how math can be used to calculate and analyze how electricity causes air pollution. Students design a campaign to educate family members on ways they can save electricity. They create a graph that compares two electric...
PBL Pathways
Students and Teachers 2
Examine trends in student-to-teacher ratios over time. Building from the first task in the two-part series, classes now explore the pattern of student-to-teacher ratios using a non-linear function. After trying to connect the pattern to...
Mathematics Vision Project
Module 2: Systems of Equations and Inequalities
The brother-sister pair Carlos and Clarita need your class's help in developing their new pet sitting business. Through a variety of scenarios and concerns presented to the siblings, the learners thoroughly explore systems of equations...
Curated OER
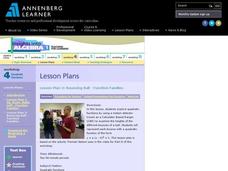
Bouncing Ball : Function Families
A bouncing ball serves as more than entertainment when learning to apply quadratic functions to real-world events. This is the second of a two-part activity, which can also be accessed from the website. The instructions say to measure...
Curated OER
Measurement and Algebraic Thinking
Comparatively speaking, does a bug travel farther than a human in 10 seconds? Get a bug and measure how far it travels in 10 seconds. Have a human team member run for 10 seconds and calculate the distance ran. Answer the question,"Who...
Curated OER
Pictograph to Bar Graph
Second graders explore organizing data to make it useful for interpreting picture graphs and bar graphs. They use Graphers software to create a pictograph and a bar graph.
Curated OER
Pike Problems in Lake Davis
Pike fish pose a threat to native trout and catfish in lakes. Would you drain and poison a lake to get rid of the Pike fish? If the lake was drained and poisoned, then refilled and repopulated with trout and catfish, how would you...
Radford University
Finding Slope
The class takes a trip about the school and find four places to measure the rise and run of objects that represent slope in the building. Pairs work together to calculate the slope of each object and determine whether any ramp they find...
Curated OER
Is the Rainbow Fair?
Third graders perform statistical calculations. Given a bag of Skittles, 3rd graders sort and collect data regarding the colors included in their bag. Using spreadsheet software, students create a bar graph of the information collected....
Curated OER
Virtual Field Trip
This hands-on resource has future trip planners analyze graphs of mileage, gasoline costs, and travel time on different routes. While this was originally designed for a problem-solving exercise using a Michigan map, it could be used as a...
Curated OER
Tune...Um!
Students collect real data on sound. In this algebra lesson plan, students use a CBL and graphing calculator to observe the graph created by sound waves. They draw conclusion about the frequency of sound from the graph.
Curated OER
Let's Gather Around the Circle
Scholars explore the relationship between circumference and diameter. Groups of learners measure the diameter and circumference of round objects and record their data on a given worksheet. They then input the data into their graphing...
Beyond Benign
Water Bottle Unit
How much plastic do manufacturers use to create water bottles each year? The class explores the number of water bottles used throughout the years to determine how many consumers will use in the future. Class members compare different...
Curated OER
Wind
Learners make a wind vane, anemometer, wind spiral, and wind streamer to calculate wind movement. In this wind lesson plan, students test each of their wind instruments, and graph the results of the wind speed in different locations.


