Curated OER
Monster Data
An inventive lesson shows learners how to collect, organize, and present mathematical data. They access websites which lead them through a variety of ways to engage in data collection. They get to design and create graphs, and present...
Fort Bend Independent School District
Data Analysis - AP Statistics
What better way to study survey design than to design your own survey! Bring a versatile data analysis project to your AP Statistics class, and encourage them to apply the practices from their instructions to a real-world survey...
Curated OER
"Lucky Charms": Interpreting Data and Making Predictions
Seventh graders determine if a "lucky charm" will increase their chances of winning a game. Students calculate the experimental probability of each player in a game. They observe and collect data from each activity. Students compare the...
Curated OER
Ornithology and Real World Science
Double click that mouse because you just found an amazing lesson! This cross-curricular Ornithology lesson incorporates literature, writing, reading informational text, data collection, scientific inquiry, Internet research, art, and...
Curated OER
Atlatl Lessons Grades 4-12: Lesson for Beginning Users of Atlatl
Sixth graders determine the mean, range median and mode of a set of numbers and display them. In this data instructional activity students form a set of data and use computer spreadsheet to display the information. They extend of...
Intel
Forensics: Get a Clue
Although the methods are all scientific, forensic science was started by police officers rather than scientists, who relied on observation and common sense. Young detectives use many tools to solve crimes around the school in a...
Curated OER
Data Analysis
Twelfth graders collect and analyze data. In this secondary end-of-course mathematics lesson, 12th graders formulate a question they would like to answer and decide on an appropriate means of data collection. Students...
Curated OER
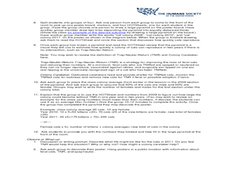
Human Face of Mathematics - Mathematics in Aboriginal Culture
Students collect statistical data. In groups, students play a dart game and then determine the distance between darts. They collect the data and plot the information on a coordinate plane. They identify the mean and the...
Curated OER
Data From Interviews
Learners create and conduct a survey about favorite foods, gather and represent the data, interpret data and make predictions to present to the class. They create and use interview questions to gather data. Pupils are explained that...
Curated OER
The Power of Graphical Display: How to Use Graphs to Justify a Position, Prove a Point, or Mislead the Viewer
Analyze different types of graphs with learners. They conduct a survey and determine the mean, median and mode. They then identify different techniques for collecting data.
Curated OER
Polluting the Environment
Fourth graders construct mini-ecosystem, pollute the ecosystem, observe, collect, and record data on the effects of these pollutants on their ecosystem, organize data on spreadsheets, create graphs, and design presentations to share with...
Curated OER
A Statistical Study of Three Biomes
Students collect data from one of three selected biomes. Data are then organized and statistically analyzed. This project engages students of different backgrounds grouped cooperatively in a relevant outdoor hands-on learning experience.
Radford University
The Science of Surveys
To drill or not to drill? An informative unit has scholars first research the advantages and disadvantages of oil drilling in Alaska. They set up and conduct a sample survey to assess attitudes toward oil drilling in a specific...
Curated OER
Endocrine Disruptors in Our Drinking Water: Should We Be Concerned?
High schoolers investigate the different hormone contaminants in the water supply. In this math lesson, students analyze data tables and graphs. They demonstrate exponential growth and decay using frog populations.
Curated OER
Trajectory Perplexity
Students investigate measuring angles correctly through projectiles. In this geometry lesson, students launch a projectile to investigate the importance of how to measure an angle correctly and to explore trajectory. They collect...
Curated OER
Research Question, Hypothesis and Experimental Design
Young scholars discuss steps of the scientific process, as well as, observe a picture of the beach that they will visit. Students create a testable hypothesis about marine debris at the beach. In this science lesson, young scholars...
Curated OER
The Nature and Science of Technology
Fifth graders practice using the scientific method by observing and creating mold. In this bacteria instructional activity, 5th graders experiment creating their own mold and fungus using petri dishes and oatmeal. Students...
Curated OER
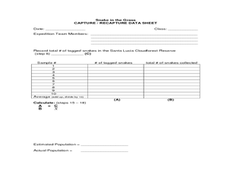
Snake in the Grass: Capture/Recapture Activity
Learners estimate the total number of species in Ecuador using the capture/recapture method. They collect data about each species and act as members of a science expedition to determine the total number of species by using mathematical...
Curated OER
Chucky Chickadee's Bird and Breakfast: Sing in Please
Students observe bird feeding and complete a tally and graphing activity for their observations. In this bird graphing lesson, students work in teams to observe bird feedings. Students complete a bird reporting sheet and collect data...
Curated OER
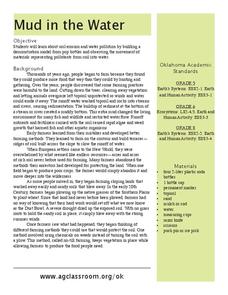
Mud in the Water
Sixth graders investigate erosion. In this erosion lesson plan, 6th graders explore how farming changes the environment. Students construct an erosion model and research ways to protect the soil from excess mud generated by farming.
Curated OER
Go The Distance Car Construction
Students build and program a car to drive a specific challenge distance.They must at the end of the lesson, have the car that stops the closest to a challenge distance.
Curated OER
I'm a Weather Watcher Watching plants grow by......my,my,my
Young scholars investigate how weather affects how plants grow. They collect data on weather and plant growth for a week and display the data on a graph. For a culminating experience they design a movie using software that shows plant...
Curated OER
Graph and Compare the Adventure's Temperature Vs. Local Temperature
Students explore the concept graphing data. In this graphing data lesson, students use weather data from their local weather and some other city and graph them. Students plot the local weather vs. another city. Students record...
Curated OER
The Tale of the Feral - Care and Multiplication of Feral Cats
Students differentiate between a feral cat and a domesticated cat. In this cat lesson plan, students use the scientific method, calculate averages, solve story problems, and learn how a caretaker can help a feral colony live safely.


