Curated OER
Assessing and Investigating Population Data
Students examine population projections. In this population data lesson, students research and collect data on the population of the United States. They explore and conclude future population growth patterns. Students construct tables...
Curated OER
Ornithology and Real World Science
Double click that mouse because you just found an amazing lesson plan! This cross-curricular Ornithology lesson plan incorporates literature, writing, reading informational text, data collection, scientific inquiry, Internet research,...
Curated OER
Analyzing Discrete and Continuous Data in a Spreadsheet
You are what you eat! Your statisticians keep a log of what they eat from anywhere between a day to more than a week, keeping track of a variety of nutritional information using a spreadsheet. After analyzing their own data, individuals...
Curated OER
Data Analysis
Twelfth graders collect and analyze data. In this secondary end-of-course mathematics lesson, 12th graders formulate a question they would like to answer and decide on an appropriate means of data collection. Students present their...
University of Minnesota
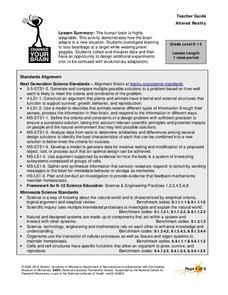
Altered Reality
Fascinate young life scientists by showing them how their brain learns. By using prism goggles while attempting to toss bean bags at a target, lab partners change their outlook on the world around them, producing amusing results....
Curated OER
Ocean Exploration: Shapes and Patterns Under the Sea
So many shapes in our vast oceans. Young explorers can discover new shapes in a variety of ways in this lesson. One way is having free exploration with a pattern shape kit handed out by the teacher. Another is by viewing a video, Ocean...
Curated OER
Lesson: Culture & Change
Can a palace door be art? Can it facilitate an understanding of people and places? It certainly can! Using a palace facade as a lesson catalyst, kids will discuss geometric patterns, the kingdom of Swat, and geopolitical themes. They...
Curated OER
Bias in Statistics
Students work to develop surveys and collect data. They display the data using circle graphs, histograms, box and whisker plots, and scatter plots. Students use multimedia tools to develop a visual presentation to display their data.
Curated OER
Student Heights
Young scholars measure the heights of their fellow classmates and create a box and whisker plot to display the data. In this measurement lesson plan, students analyze the data and record results.
Curated OER
Formation of Rain
Students sequence the steps leading to the formation of rain, and design a model to represent these steps. This task assesses students' abilities to classify, generalize, infer, interpret and communicate data, and construct a pictorial...
Curated OER
Weather "Whys"
Students complete activities to explore fall weather. In this weather lesson, students use the given links to examine weather forecasts. Students complete a weather graph activity and watch Internet field trips. Students complete fall...
Curated OER
Weaving Weather Maps with the World Wide Web
High schoolers access the Internet and use real time data from the American Meteorological Society to create a detailed weather map. They make weather predictions based on the data collected.
Curated OER
Design Patterns in Everyday Life
Learners find symbols and patterns in everyday life. In this patterns lesson, students break into groups and look for specific patterns and symbols. Learners record their findings. Students create a graphic organizer with the information.
Curated OER
Graphing Family Reading Habits
Second graders collect data from their families about their reading habits and graph them. In this graphing family reading habits lesson, 2nd graders interview family members about their reading habits. They then use a graphing computer...
National Gallery of Canada
Counting Circles
Learners look at bands of colors and estimate how many rings of color there are. While working in groups, they come up with a plan of how to accurately count the rings. They attempt to find a pattern in the colors, and decide whether...
W.K. Kellogg Biological Station
Succession: Patterns in the Field and in Seeds
Have you been wondering how to use that natural trail at or near your school? This activity gets kids outside with a purpose: learn about ecological succession through field observations and collecting seed and soil samples. The resource...
Curated OER
Graphing Fun
First graders analyze objects and make a graphing picture to analyze the data. In this graphing lesson, 1st graders complete an object graph assessment, a picture graph assessment, and a bar graph assessment to analyze their given objects.
Curated OER
Displaying the Data
Students gather facts about their parent's families through the completion of parent interview forms. Using tally marks, the data gathered is counted, transferred to graphs and used to create family timelines.
Curated OER
Interaction at a Distance
Students explore magnetism. In this magnetism lesson, students discover the purpose of different magnets. Students perform an experiment by testing the magnetism through different items. Students collect data on the experiment.
Curated OER
The Greenhouse Effect
Seventh graders investigate the temperature change in open and closed containers. In this earth science lesson, 7th graders relate this lab activity to greenhouse effect. They create a line graph from data collected in the experiment.
Curated OER
Tall Tale Rollers
Students explore American tall tales. In this tall tale lesson, students discover the six characteristics that are included in tall tales. Students survey their class to find each student's favorite tall tale character and organize the...
Curated OER
Survival of the Fittest – Battling Beetles
Students explore natural selection. For this genetic adaptation lesson, students discover why certain traits continue and some traits disappear. Students discover how species evolve and change. Resources are provided.
Curated OER
Virtual Field Trip
This hands-on resource has future trip planners analyze graphs of mileage, gasoline costs, and travel time on different routes. While this was originally designed for a problem-solving exercise using a Michigan map, it could be used as a...
Curated OER
Pop-Up Stepping Stones
Learners become aware that humans exhibit a predictable growth pattern and then research their families progression of child birth. They collect their research data and design a keepsake of their milestones in chronological order.


