Curated OER
Student News And Weather Channel
Fabulous! Your 5th graders should love this project. As an ongoing lesson throughout the year students use temperature probes to record outside temperature and then document their data using spreadsheets. They use their weather data and...
Curated OER
Using Spreadsheets and Graphs
Third graders explore mathematics by utilizing computers. In this graphing lesson, 3rd graders gather class data based on a particular topic such as the "favorite candy" of the class. Students utilize this information and computers to...
Curated OER
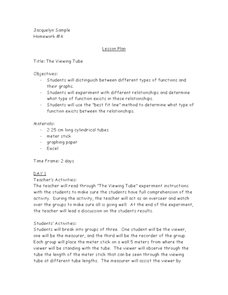
The Viewing Tube
Looking for an excellent lesson that incorporates math, science, and technology? Groups of three students use a viewing tube to perform an experiment, and discover how to organize their data into an Excel spreadsheet. This is a...
Bowland
Speed Cameras
Do speed cameras help reduce accidents? Scholars investigate this question using a series of spreadsheet activities. Along the way, they learn about randomness, probability, and statistical analysis.
Intel
Pedal Power
Show your classes the importance of mathematics in something as simple as bicycle design. The final lesson in the six-part STEM series has each group research a different aspect of the bicycle. Learners use mathematical formulas, linear...
Curated OER
Super Spreadsheets
Middle schoolers discover information about each of the fifty states in the United States. In groups, they create a spreadsheet organizing the information to show to the class. They discover different ways to display the data and...
Curated OER
Life Through Time: The Heart of the Phanerozoic
Students gain a deeper understanding of geological time and the evolution of life on Earth. They use iMovie to tell a complex story of a discrete time period with narration and images.
Curated OER
Introduction to Spreadsheets
Sixth graders utilize Excel or other spreadsheet software to create both text and numerical valued columns to produce a Christmas or birthday wish list. They study the difference between text and numerical values for column use and...
Curated OER
Holiday Cards using Publisher
Students create a holiday card using technology. In this technology lesson plan, students use Publisher templates to create a holiday card. Students organize, design, and edit their card.
Curated OER
How Much Is It?
Learners explore foreign currencies. In this foreign currencies lesson, students simulate travel to another country and determine the value of the US dollar compared to other countries. Learners use a conversion table and search Internet...
Curated OER
Are You Here Today?
Students recognize their own name in print and the names of their classmates. They use one to one correspondence to determine who has not checked in, completed their field, and if absent indicate that on the form. Students tally the...
Curated OER
Million Dollar House
Fourth graders use a combination of calculators and spread sheet software to furnish their own million dollar horse without going over the specified amount of a million. The goal being to create a house that came to the exact amount of...
Curated OER
Touring the Regions of the United States
Fifth graders explore the regions of the United States. They use maps, research on the Internet and use measurements and estimations. Students create a presentation using spreadsheets and publishing software.
Curated OER
Level III: Technology Integration
Fourth graders prepare two spreadsheets each with an embedded line graph that displays data about the growth of the bitter rot fungus on apples and on petri dishes that were stored in the refrigerator and the classroom. They prepare a...
Curated OER
Irish Eyes: Taking a Look at Local Landscape
Direct your class’s attention to the elements that make their community unique. After examining sample travel brochures, groups select something from their community to use as the subject, and then research, create, and publish a...
Curated OER
What Makes Our Community Special?
Explore websites, complete research, and use technological tools to create a final multimedia presentation on what makes a community special. Learners of all ages work with a partner to research an interesting aspect of their community,...
Curated OER
Creating a Bar Graph Using a Spreadsheet: Dice Rolling Probabilities
Tenth graders explore the concept of spreadsheets. They create a simple spreadsheet and chart from given data. Students perform basic formatting procedures on their chart. They use spreadsheet functions to perform calculations.
Curated OER
Graphing Favorite Holidays
Students create spreadsheets and bar graphs based on results of survey of favorite holidays.
Curated OER
Embracing Diversity
Students explore and use different computer programs for collecting data. For this technology based lesson, students set up a survey and use the Excel and Lotus software to collect data.
Curated OER
Dino-Myte Spreadsheet
Do your learners like dinosaurs and theme parks? An ambitious lesson invites learners to put together a plan for supplying dinosaurs for a new theme park. Pupils work together in groups to come up with their plan, which must include a...
Curated OER
A Fishy Tale
Eighth graders do a research project on a particular species of Atlantic seafood and record and graph information pertaining to commercial landings of that species of seafood. They use a website and an Appleworks spreadsheet.
Curated OER
Spreadsheet Graphs
Students create graphs using information from spreadsheets. They select a topic from the following choices: website use, digital cameras, spreadsheets, calculators or educational software. They tally the class results and create an...
Curated OER
Computer Science: Pendulum
Students investigate the basic properties of pendulums as a function of spreadsheets. Working in groups, they measure the period for a pendulum at six different lengths and record the results. They prepare a file using Microsoft Excel...
Curated OER
Topic 6: Evaluating and Presenting Results
Students construct spreadsheets from raw data. In this spreadsheet construction lesson, students compile data into Microsoft Excel. Students familiarize themselves with entering and presenting data in a spreadsheet.


