Curated OER
Grade 2: Spinning Sums
Second graders collect data by spinning two spinners and creating sums, organize the data, and make conclusions from the data. Each students makes a spinner. They spin and record the number of the section each time. Students work in...
Curated OER
Springy Legs
Fifth graders measure their body height and the height they can jump. They use these measurements in forms of ratios, fractions and decimals to describe their Springy Legs Factors (SLF). Students compare their SLFs to other people's...
Curated OER
RISKY BUSINESS--OR NOT!
Students learn about the importance and risk that stocks carry within a business. In this financial management lesson, students use role play and case scenario situations to decide what stocks are best for given companies. Based on the...
Curated OER
Hop To It!
Students explore the aspects of a frog's anatomy that allow it to be such a good jumper and jump and record the length of each jump to determine which style of jumping allows them to jump the farthest.
Curated OER
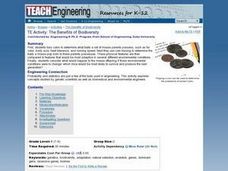
The Benefits of Biodiversity
Students examine the concept of biodiversity. They toss coins to determine what traits mouse parents have and the babies traits as well. They predict what would happen to the baby mice if the traits of the parents were different.
Curated OER
Changing Ramp Heights
Learners conduct an experiment to determine how the change in ramp height affects the distances a ball is able to move a stationary cup. Data is collected from several trials and recorded and analyzed.
Curated OER
Sets an the Venn Diagram
Students explore the characteristics of sets and Venn Diagrams. Given data, students practice determining the placement of elements in a Venn Diagram. Students discuss the correspondence between data sets and their graphical...
Curated OER
Geometry and Measurement
Learners view a right triangle displayed by the teacher. Students measure legs and the interior angles of the triangle. They look for a pattern or relationship between the legs and angles. Learners use pegboards and string to create more...
Curated OER
Yeast - A Dihybrid Cross
Students make a yeast dihybrid cross and follow two forms of each of two traits: red growth versus cream color, and tryptophan-dependent versus tryptophan-independent.
Curated OER
Grade 5: Alphabet Frequency
Fifth graders collect and organize data from writing samples, use fractions and decimals to describe the experimental data, and use the experimental results to make predictions about the frequency of letter usage in the English language.
Curated OER
The Human Line Plot
Fifth graders collect data and use charts and line plots to graph data. Through class surveys, 5th graders collect data concerning a particular subject. They graph their data using a line graph. Students make inferences and predictions...
Curated OER
Designing Samples/Simple Random Samples
Students explore the concept of sampling techniques. In this sampling techniques lesson, students identify possible sources of bias in situations such as phone polls, supermarket surveys, and drawing names from a phone book. Students...
Curated OER
Line of Best Fit
Students explore the concept of linear regression. In this linear regression instructional activity, students do a Barbie bungee activity where they collect linear data. Students plot their data using a scatter plot. Students determine a...
Curated OER
Does Shape Affect Drag?
Students study drag and how it affects a parachute in the sky. In this parachutes lesson students build models and compare their drag.
Curated OER
How Do They Relate? Linear Relationship
Young scholars collect information and use a line to represent it. In this algebra lesson, students investigate real world data to see if it makes a line. They graph the line comparing the relationship of the x axis with that of the y axis.
Curated OER
Rotation Sensor Challenge
Students participate in a challenge to construct a rotation sensor with the highest degree of accuracy and repeatability. They conduct computer analysis of their sensor using repeated trial.
Curated OER
Insect Classification
Students compare and contrast the visible structures of three insects based on photographs. They differentiate characteristics of crane flies, ants, and wasps then create a simple classification system.
Curated OER
Caloric Expenditure in Powwow Dancing
Sixth graders investigate the meaning of different types of Native American music and dance. They determine how this music and dance has contributed to modern music and dance. They problem solve to determine the average length of the...
Curated OER
Parachutes: Is it Surface Area or Shape?
Students investigate how to make a good parachute. For this physics lesson, students observe the motion of parachutes as it falls and measure the time. They collect data and calculate the average descent time for each canopy shape.
Other popular searches
- Probability and Statistics
- Probability Statistics
- Probability" | "Statistics
- Probability & Statistics


