Texas Instruments
Drawing a Line Tangent to a Circle
Explore lines tangent to a circle. For this math lesson, learners manipulate circles and lines on a TI calculator. They draw a circle and analyze perpendicular lines intersecting the circle in only one place. This activity works...
Las Cumbres Observatory
Calculating the Age of Solar System Objects
The number of craters on the surface of solar system objects has a direct correlation to its age. Learners use the concept to determine the age of several objects in the solar system. Using satellite images, they count craters within a...
Texas State Energy Conservation Office
Nuts! Calculating Thermal Efficiency
Oh nuts! Do macadamias or almonds produce more thermal energy? Energy enthusiasts find out with this experiment. The objective is to demonstrate to your class how the chemical energy contained in foods can be converted into useable...
Curated OER
Investigating Linear Equations Using Graphing Calculator
Young scholars investigate linear equations using the Ti-Calculator. For this algebra lesson, students graph lines and identify the different quadrants on a coordinate plane. They identify ordered pairs used to plot lines.
EngageNY
Calculating Probabilities of Events Using Two-Way Tables
Tables are useful for more than just eating. Learners use tables to organize data and calculate probabilities and conditional probabilities.
Curated OER
Calculating the Cost of Living
Bring Consumer Mathematics and Economics to life with this lesson, where learners investigate personal finance and budgeting. They use the newspaper’s classified section to determine a future job and potential earnings and determine a...
EngageNY
Calculating Conditional Probabilities and Evaluating Independence Using Two-Way Tables (part 1)
Being a statistician means never having to say you're certain! Learners develop two-way frequency tables and calculate conditional and independent probabilities. They understand probability as a method of making a prediction.
Curated OER
The Study of Molecular Orientation by Linear Dimension Change of Polymeric Films
Young scholars investigate the linear dimension change of heated plastic film and relate the results to processing and service use of the materials. They calculate percent change in dimension as related to anisotropy and molecular...
Mathematics Assessment Project
Calculating Arcs and Areas of Sectors of Circles
Going around in circles trying to find a resource on sectors of circles? Here is an activity where pupils first complete an assessment task to determine the areas and perimeters of sectors of circles. They then participate in an...
Curated OER
Conversation Heart Graphing
Sixth graders review the different types of graphs (bar, line, pictograph) They predict the data set they can garner several boxes of conversation hearts. Students record their data using an Excel spreadsheet. They create a graph based...
Curated OER
Number Sense
Students convert between decimals and fractions. In this algebra lesson, students show their knowledge of numbers by putting them on a number line. They apply the concept of algebra to solving word problems. Students will use a Ti...
Curated OER
Stream Study
Students study the characteristics of a stream habitat. In this life science lesson plan, students use sieves, nets, and jars to collect aquatic organisms. Students also measure the temperature of the stream and calculate the speed of...
Curated OER
Sign of the Derivative
Learn how to investigate the change in a graph by dragging the cursor to observe the change in the function. They use the TI calculator to graph their parabola.
Curated OER
Transformations of Functions 2
Solving problems on the TI graphing calculator can be quite easy. Students observe the properties of transformation of functions and create a formula for the transformation.
Curated OER
Exponential vs. Power
Pupils differentiate between exponential and power functions. They identify the base, exponent and properties of exponential functions. They also graph the functions using the TI calculator.
Ohio Department of Education
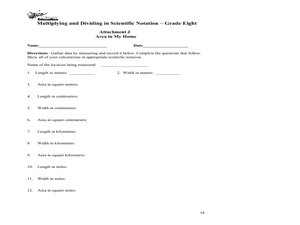
Multiplying and Dividing in Scientific Notation - Grade 8
Here is really nice set of resources on scientific notation. Eighth and ninth graders explore the concept of multiplying and dividing in scientific notation. In this multiplying and dividing numbers in scientific notation...
CK-12 Foundation
Stratified Random Sampling: An Extracurricular Study
Learning isn't a random process. A well-designed interactive lesson helps classes make key conclusions about stratified random sampling. They calculate group percentages and use those percentages to decide on sampling totals.
Curated OER
The Disappearing Kelp Forest
Learners observe the effect "El Nino" left on kelp plants and sea urchins. They analyze the data collected by researchers, by graphing it on a TI calculator. Before graphing and analyzing the data, you may want to revisit the events of...
Statistics Education Web
It Creeps. It Crawls. Watch Out For The Blob!
How do you find the area of an irregular shape? Class members calculate the area of an irregular shape by finding the area of a random sampling of the shape. Individuals then utilize a confidence interval to improve accuracy and use a...
Curated OER
Probability Experiment Simulation: Design and Data Analysis Using a Graphing Calculator
Seventh graders simulate probability experiments. Using a graphing calculator, 7th graders design, conduct, and draw conclusions from simulations or probability experiments. Students construct frequency tables and compare the...
Curated OER
Variables Affecting Earth's Albedo
Students study the variables that affect the Earth's albedo. In this environmental data analysis activity students interpret and graph information and calculate changes.
Curated OER
Calculator Art
Students identify the relationships among different parts of a nation's culture. They discover elements of mythology, legends and values.
Curated OER
Representing Numbers Using Scientific Notation
Learners explore the concept of scientific notation. For this scientific notation lesson, mathematicians discuss how multiplying by a power of 10 affects the decimal. They play Powers of 10 Yahtzee. Students roll a die five times and...
Curated OER
A Heated Discussion
Students compare the colloquial definition of temperature with the scientific definition. They, in groups, then explore the changes of water under different temperatures and calculate and compare their findings on three different...
Other popular searches
- Graphing Calculator Skills
- Calculator Skills Memory
- Calculator Skills Ti84
- Calculator Skills Code Words
