Curated OER
Data
Students collect data from an experiment they perform. For this data lesson, students use multiple representations to solve practical problems; describe advantages and disadvantages of the use of each representation. Then, they evaluate...
Curated OER
Ornithology and Real World Science
Double click that mouse because you just found an amazing lesson! This cross-curricular Ornithology lesson incorporates literature, writing, reading informational text, data collection, scientific inquiry, Internet research, art, and...
Curated OER
States Of Matter
Delv into the states of Matter. Students engage in the scientific inquiry process to uncover the exciting world of Matter. They watch a series of videos, and conduct experiments in order to collect and analyze data on the various state...
Chicago Botanic Garden
Plant Phenology Data Analysis
Studying data over time can paint a pretty interesting picture. Learners use data they collected in the previous instructional activity to compare to historical data in a similar region. They graph the data of the first bloom of a...
Curated OER
Bird Ecology Unit
Birds, plants, and vegetation, is there anything more lovely? There is! Engage your class in the scientific process, data collection, and data analysis. They stroll their campus observing and identifying various birds and plants,...
Curated OER
Are We Couch Potatoes or Busy Bees? Data Analysis of Physical Activity in School
Young scholars study practical data analysis within the constraints of the scientific method. For this data lesson students collect and enter data into a computer spreadsheet then create graphs.
NOAA
History's Thermometers
How is sea coral like a thermometer? Part three of a six-part series from NOAA describes how oceanographers can use coral growth to estimate water temperature over time. Life science pupils manipulate data to determine the age of corals...
Curated OER
Speed
Fifth and sixth graders practice working in pairs to determine whether they can walk with constant speed. They test themselves, collect their data, draw graphs with their data collected, manipulate the data, and then draw conclusions...
NASA
A Different Perspective
What can we learn from the data? Young scholars analyze actual solar data to answer specific questions. The activity presents an opportunity for an open-ended investigation of the data to conclude a five-part series on solar winds.
Curated OER
Weather, Data, Graphs and Maps
Students collect data on the weather, graph and analyze it. In this algebra instructional activity, students interpret maps and are able to better plan their days based on the weather reading. They make predictions based on the type of...
Curated OER
Data and Scientific Graphs
Students conduct experiments and graph their data. In this statistics lesson, students collect data and graph it on a coordinate plane. They analyze the data looking for patterns and they discuss their findings with the class.
Curated OER
Comparing Data
Eighth graders create a survey, gather data and describe the data using measures of central tendency (mean, median and mode) and spread (range, quartiles, and interquartile range). Students use these measures to interpret, compare and...
Curated OER
Frost Depth Study
Students complete activities to study the frost and frost depth. For this frost study lesson, students use frost tubes to study and measure the frost at their school. Students measure the frost in the tube and enter their data online to...
Howard Hughes Medical Institute
EarthViewer
Can you imagine Washington DC and London as close neighbors occupying the same continent? Learners will be fascinated as they step back in time and discover the evolution of the earth's continents and oceans from 4.5 billion...
University of Georgia
Freezing and Melting of Water
Examine the behavior of energy as water freezes and melts. An engaging activity provides a hands-on experience to learners. Collaborative groups collect data and analyze the graphs of the temperature of water as it freezes and then...
Virginia Department of Education
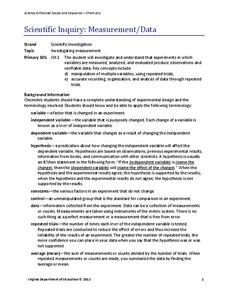
Scientific Inquiry: Measurement/Data
While pupils design their own lab experiments, they will not form a new species. Scholars take their materials and design an experiment regarding reaction rates.
Curated OER
Physical Science: Festival of Bubbles
Investigate bubbles through the use of scientific inquiry. Pupils blow bubbles using several methods and measure the resulting bubble print. Measurements are recorded on a data table and transferred to a bar graph. Results are discussed...
Curated OER
temperature and the Scientific Method Lesson Plan
Sixth graders study heat, temperature, and heat transfer. Using probeware, the teacher demonstrates boiling points. Students participate in experiments and record the beginning and ending temperatures and mass of objects. After...
Curated OER
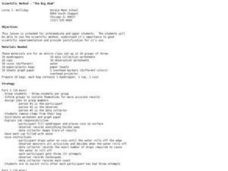
Scientific Method- "The Big Ahah"
Students experiment with water, dropper and a coin to study the scientific method. In this scientific method lesson plan, students are in groups, each with a coin, water and a dropper. They investigate how many drops of water can fit on...
NASA
Developing an Investigation
Watch as your class makes the transition from pupils to researchers! A well-designed lesson has scholars pick a solar wind characteristic to research. They then collect and analyze official data from the LANL website. This is the...
Curated OER
A Planting We Will Go
Even the youngest kids can make scientific comparisons using collected data. They read The Tiny Seed, then discuss the essential nutrients and elements needed for a seed to grow into a blooming plant. They plant seeds and track their...
Curated OER
From Curiosity Cabinet to Museum Collection
Students study binomial nomenclature and museum-based research. They create a curiosity box, label the objects in their curiosity box , develop a classification scheme for the objects, and create a database of all objects collected by...
Curated OER
Get the Picture!
Astronomers practice downloading data from a high-energy satellite and translate the data into colored or shaded pixels. As a hands-on activity, they use pennies to simulate high-energy satellite data and they convert their penny...
Curated OER
Designing the Experiment and Answering the Question
Students investigate scientific methods by analyzing an article from the Natural Inquirer. In this data analysis lesson, students read an article from the magazine and discuss at least 2 scientific methods that could be used to...


