EngageNY
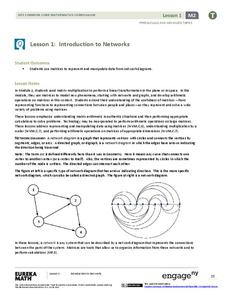
Introduction to Networks
Watch as matrices break networks down into rows and columns! Individuals learn how a network can be represented as a matrix. They also identify the notation of matrices.
Curated OER
Class Birthday Graph
Students analyze the basics of an Excel spreadsheet. They highlight cells in a spreadsheet. They make a column graph. Students are introduced to X-axis and Y-axis. They play various address games on the spreadsheet.
CK-12 Foundation
Matrices to Represent Data: Houndstooth
Apply matrices to fashion. Here your classes use a matrix to create a popular clothing design. As they construct the pattern, they review the dimensions of a matrix by considering the rows and columns.
Curated OER
Test Your Speaking & Listening Skills: Class Survey Template
This blank template is the perfect tool for your English language learners conducting short surveys. They record the name of each individual surveyed, and they come up with their own survey topics (which are recorded in the first row)....
Curated OER
NUMB3RS - Season 2 - "Convergence" - Air Hockey
Learn how to use a matrix to organize data to solve a problem. This activity uses wins and losses to rank players for an air hockey tournament they wish to have. After practicing some basic matrix operations the class could do the...
Curated OER
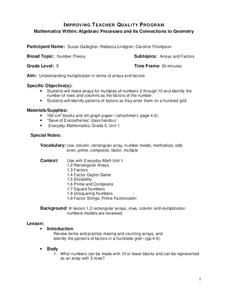
Mathematics Within: Algebraic Processes and Its Connections to Geometry
Fifth graders discover the connections between algebra and geometry. With a focus on arrays and factors, they are introduced to multiplication. They develop an array for multiples of 2 through 10 and identify the factors of each row....
Curated OER
Using Averages to Create Graphs Through Excel
Sixth graders create and use a spreadsheet to make graphs which will be used to analyze Progress Report and Final Report Card grades. They practice finding the mean, median, mode, and range of a data set. Students also incorporate column...
Curated OER
Math: Collecting and Analyzing Date
Children count how many of an activity they can do in a row, such as ball tossing and record the date and count. Children track over a period of time and graph results.
Curated OER
Hello Bingo!
Students in an ESL class practice their English by talking to their classmates. Using a worksheet, they put the name of their classmate that meets the criteria in the box. They compete with one another to get five boxes in a row to...
EngageNY
Calculating Conditional Probabilities and Evaluating Independence Using Two-Way Tables (part 1)
Being a statistician means never having to say you're certain! Learners develop two-way frequency tables and calculate conditional and independent probabilities. They understand probability as a method of making a prediction.
Curated OER
ROV Grid Search
Pupils perform activities to recreate the exploration of the sea bottom. They attach magnets to the bottom of the remote controlled car to see how many camouflaged objects it can pick up. As a class, students examine the results of...
SeaWorld
Marvelous Manatees
Here is an interesting lesson plan on the manatee for your upper graders or middle schoolers. A game is played where learners work together to complete a successful manatee migration. It's a board game, and all of the game components are...
EngageNY
Association Between Categorical Variables
Investigate associations between variables with two-way tables. Scholars continue their study of two-way tables and categorical variables in the 15th installment of a 21-part module. The lesson challenges them to calculate relative...
Mathematics Vision Project
Module 10: Matrices Revisited
A matrix is just a fancy way of making a table. Young scholars explore operations with matrices with the first lessons in the final module of a 10-unit Algebra II series. After adding, subtracting, and multiplying matrices, pupils use...
EngageNY
Summarizing Bivariate Categorical Data in a Two-Way Table
Be sure to look both ways when making a two-way table. In the lesson, scholars learn to create two-way tables to display bivariate data. They calculate relative frequencies to answer questions of interest in the 14th part of the series.
Curated OER
US Population 1982-1988
Your algebra learners make predictions using the concepts of a linear model from real-life data given in table form. Learners analyze and discuss solutions without having to write a linear equation.
5280 Math
Multiplication Table Algebra
Patterns, patterns, everywhere! Young scholars examine the multiplication table to identify patterns. Their exploration leads to an understanding of the difference of squares and sum of cubes by the completion of the algebra project.
Illustrative Mathematics
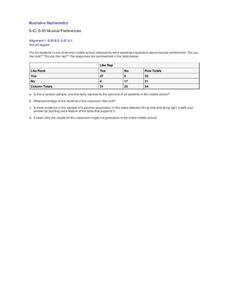
Musical Preferences
If you like rap music, are you more likely to like rock music? Use statistical analysis to determine if there is a positive association between rap and rock in this particular sample. While the problem is relatively simple, the...
Physics Classroom
Action-Reaction Lab
Computer-interfaced motion detectors are required to carry out this inquiry. It is a new twist on exploring motion with plunger carts: they are set back-to-back and then propelled away from each other. Their velocities are measured, and...
San Francisco Symphony
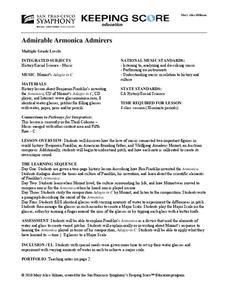
Admirable Armonica Admirers
What do Ben Franklin and Wolfgang Mozart have in common? Find out about the musical invention, the armonica or glassy-chord. Learners will read about how Ben Franklin invented this new instrument and how Wolfgang Mozart came to play it....
Curated OER
Patterns in the Multiplication Table
Explore patterns in the multiplication table in order to deepen your third graders' understanding of this essential skill. Implement this activity as a whole-class lesson, allowing students to work in pairs or small groups to support...
Curated OER
Upwelling Terrestrial Radiation
Students calculate the hourly irradiance of the earth at a site given the near-surface air temperature of the site. They compare the calculated values of irradiance with those measured by instruments at the site. Students need to...
Curated OER
What Are Elements?
Students investigate elements by by defining scientific terms. In this Periodic Table of Elements lesson, students utilize a glass of water, and powdered fruit drink to perform a lab activity demonstrating properties of certain...
Curated OER
Apple Graphing
Do you like apples? Create a taste test for your first and second grade learners. Cut red, green, and yellow apples, and have learners select their favorite. After tasting all of the apples, they collect data and graph the results with...
Other popular searches
- Rows and Columns
- Rows and Columns Charts
- Graphs Rows and Columns
- Counting Rows and Columns
- Seeing Rows and Columns
- Symbols in Rows and Columns
- Rows and Columns Geometry
- All Rows/columns Are the Same
- Table Rows and Columns
- Rows Columns Diagonals
