Curated OER
Writing Equations from a Table
Students use coordinates in a table to write equations. For this algebra lesson, students discuss rate of change as it relates to slope and x and y values. They plot the points from a table to graph their lines and write an equation for...
Curated OER
Probability Popsicle Pop-ups
Fourth graders decorate and use popsicle sticks as manipulatives to assist with their learning of probability. They utilize a worksheet imbedded in this plan to organize the results of their experiment. They make a stem and leaf plot...
Curated OER
Do the Elephants Need Sunscreen? A Study of the Weather Patterns in Etosha
Students analyze the weather patterns in Namibia. They create a graph of the yearly temperatures and use the internet to gather information. They discuss how the weather goes in cycles in the area.
Curated OER
Data Analysis and Measurement: Ahead, Above the Clouds
Students explore and discuss hurricanes, and examine how meteorologists, weather officers, and NASA researchers use measurement and data analysis to predict severe weather. They plot points on coordinate map, classify hurricanes...
Curated OER
A Tall Story
Students investigate the growth rate of a man named Bob Wadlow. In this growth rate of a man lesson, students determine if the growth rate of this particular man was normal or abnormal. Students bring in data of their height over time...
EngageNY
Linear Models
Expand your pupils' vocabulary! Learn how to use statistical vocabulary regarding linear models. The instructional activity teaches scholars the appropriate terminology for bivariate data analysis. To complete the module, individuals use...
Concord Consortium
Function Project
What if a coordinate plane becomes a slope-intercept plane? What does the graph of a linear function look like? Learners explore these questions by graphing the y-intercept of a linear equation as a function of its slope. The result is a...
Curated OER
What's The Point?
Students solve word problems using the correct math symbols. In this algebra lesson, students use the TI calculator to graph their equation and analyze it. They find the line of regression and use to draw conclusion.
Curated OER
How Does a Seed Grow Into a Plant?
Second graders explore how seeds grow into plants. They discuss types of seeds and place seeds in wet paper towels to germinate. They draw a picture in their journal to record their observations for four days. They take pictures of their...
Curated OER
Misleading Graphs
Students explore number relationships by participating in a data collection activity. In this statistics lesson, students participate in a role-play activitiy in which they own a scrap material storefront that must replenish its stock....
Curated OER
Correlate This!
Students investigate different correlations. In this algebra lesson, students analyze graphs and identify the lines as having positive, negative or no correlation. They calculate the line of best fit using a scatter plot.
Curated OER
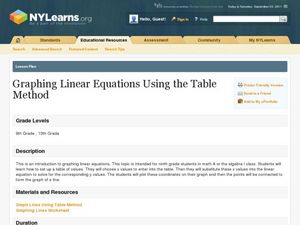
Graphing Linear Equations Using the Table Method
Students graph linear equations using a table. In this algebra instructional activity, students create a table of values using the linear equation to find the y-values. They plot their point on a coordinate plane and graph the line.
Curated OER
Price of Apples- Linear Data
Students collect data and create a graph. In this algebra instructional activity, students describe functions graphically, algebraically and verbally. They identify functions as being independent and dependent using variables.
Curated OER
Batteries in Series
Eighth graders examine batteries in a series circuit and the associated voltage. They determine, through inquiry and problem solving, that the total voltage of batteries in a series is the sum of the voltage of each battery. They design...
Curated OER
Short Stories and Sitcoms
Students compare 19th Century short stories to 20th Century sitcoms. They address seven questions as the watch a sitcom for homework and create a web to use for further comparison.
Curated OER
Constellation Mapping
Students plot constellations on a grid map. They discuss the various ways early explorers planned their travels. Students identify and recognize major constellations. They color their maps and take them home to try to find various...
Curated OER
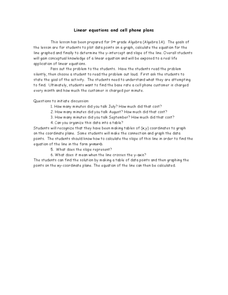
Linear Equations and Cell Phone Plans
Students calculate the amount of minutes they get charged for each month. In this algebra lesson, students relate linear equations to talking on the phone and the cost to do so. They create graph to plot the cost and usage of the cell...
Curated OER
It's a Drag!
Students create number lines using decimals and whole numbers. In this algebra lesson, students graph and solve linear equations. They plot ordered pairs on a coordinate plane correctly.
Curated OER
Graphing Data Brings Understanding
Students collect, graph and analyze data. In this statistics lesson, students use circle, pie, bar and lines to represent data. They analyze the data and make predictions bases on the scatter plots created.
Curated OER
From Playing with Electronics to Data Analysis
Learners collect and Analyze data. In this statistics lesson plan, students identify the line of best fit of the graph. They classify lines as having positive, negative and no correlation.
Curated OER
Sonar Mapping
Students use a shoe box to create a seafloor model and use cardboard for layering inside of the shoe box to simulate the ocean floor. They probe the ocean floor to simulate sonar echoes. Finally, students graph their data to get a...
Curated OER
Linking Algebra to Temperature
Students convert between two units as they calculate the temperature. In this algebra lesson, students collect data on seasonal climate and create a graph. They make conjectures based on their data collection.
Curated OER
Linear and Nonlinear Functions
Students identify properties of a line. In this algebra activity, students differentiate between functions and nonfunctions. They use the slope and y intercept to graph their lines.
Curated OER
Handy Reflections
Learners explore reflections on a coordinate plane in this lesson. They trace their hand on a grid, determine the coordinates of each point, and create a scatter plot of their points. Pupils use this information to investigate aspect...


