Virginia Department of Education
Independent and Dependent Variables
Investigate the relationship between independent and dependent variables. Individuals begin by identifying independent and dependent variables from different problem situations. Then, using specific guidelines, they create posters...
Shodor Education Foundation
Incline
Study velocity while examining graphical representations. As scholars work with the animation, they discover the effect the height of an incline has on the velocity of the biker. They make conclusions about the slope of the...
Balanced Assessment
Bathtub Graph
Represent the relationship between independent and dependent variables through a modeling situation. The activity expects learners to graph the volume of water in a bathtub during a given scenario. The graph should result in two areas of...
Curated OER
Graphing and Interpreting Linear Equations in Two Variables
Graph linear equations using a table of values. Learners solve equations in two variables using standard form of an equation. They identify the relationship between x and y values.
Balanced Assessment
Books from Andonov
To examine mathematical functions in a modeling situation pupils combine quadratic and step functions to represent a presented scenario. They both graph and write a function to represent data shown in a table.
Mathematics Assessment Project
Matching Situations, Graphs and Linear Equations
What do guitars, candles, and helicopters have in common? They're all in this resource. Learners complete an assessment task to determine the amount of profit made in a guitar class based on given information regarding variable...
CK-12 Foundation
Understand and Create Line Graphs: Line Graphs
Explore line graphs and their characteristics through an interactive lesson. Scholars follow a set of directions to plot data on a line graph. They then answer questions about the type of variables, minimum and maximum values, and...
Curated OER
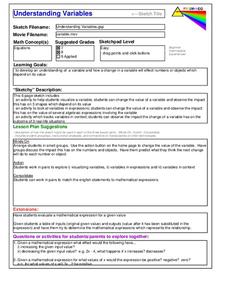
Understanding Variables
Students solve linear equations and identify the unknown. In this algebra lesson, students define a variable and use addition, subtraction, multiplication and division to solve. They change the equation depending on the value of the...
Curated OER
What's Your Shoe Size? Linear Regression with MS Excel
Learners collect and analyze data. In this statistics instructional activity, pupils create a liner model of their data and analyze it using central tendencies. They find the linear regression using a spreadsheet.
Curated OER
Forces and Graphing
Learners analyze graphs to determine relationships between variables and rates of change. They determine the basic concepts about static reaction forces. They determine the slope and equation of a line.
Curated OER
Perimeter Pattern
High schoolers investigate perimeter patterns formed by a hexagon and a triangle. They will identify the dependent and independent variable and write a function for the relationship.
EngageNY
Linear Models
Expand your pupils' vocabulary! Learn how to use statistical vocabulary regarding linear models. The lesson teaches scholars the appropriate terminology for bivariate data analysis. To complete the module, individuals use linear...
Virginia Department of Education
Functions 2
Demonstrate linear and quadratic functions through contextual modeling. Young mathematicians explore both types of functions by analyzing their key features. They then relate these key features to the contextual relationship the function...
Kenan Fellows
Least Squares Linear Regression in R
The task? Determine the how effective hospitals are at reducing the rate of hospital-acquired infections. The method? Data analysis! Using an open source software program, individuals use provided data and create scatterplots to look for...
Curated OER
The Class Trip
Mrs. Moore's class is trying to earn money for a trip to the science museum, but how much more do they need? Solve this problem with your own class as they develop their ability to model real-life situations algebraically. As an added...
Achieve
Medication Dosage
Here's the cure to boredom. Given a patient file, including medication dosage information, scholars determine the amount of medication left in the patient's bloodstream over time. They analyze the sequence of numbers and determine a...
Radford University
Pizza, Pizza!
Ponder the problem of pizza prices. Pupils use provided information about two different pricing schedules for pizza. They create tables of values and functions to represent the pricing schemes, consider domain restrictions, and identify...
Illustrative Mathematics
Chocolate Bar Sales
In this real-world example, algebra learners start to get a sense of how to represent the relationship between two variables in different ways. They start by looking at a partial table of values that define a linear relationship. They...
EngageNY
Using Linear Models in a Data Context
Practice using linear models to answer a question of interest. The 12th installment of a 16-part module combines many of the skills from previous lessons. It has scholars draw scatter plots and trend lines, develop linear models, and...
Virginia Department of Education
Logarithmic Modeling
Explore logarithms and logarithmic regression. Young mathematicians first learn about inverse functions and about the logarithm function family. They take their newfound knowledge to use logarithmic functions to model situations and...
Curated OER
Interpreting Data-Working with Controls and Variables
Young scholars review the meaning of control and variables, and state difference between dependent and independent variables. They complete a worksheet with the definitions and complete problems that show their understanding.
Curated OER
Discovering Ohm's Law
Connect math with science! Pupils apply properties of Ohms Law as they solve problems and identify the inverse relationship of a function. They analyze the shape of the graph of an inverse function and use it to make predictions.
Howard County Schools
Setting the Table
How many people can fit around a table? Depends on the size of the table, right? Explore patterns to generate an equation for the number of people that can fit around a table given its size.
Curated OER
Stochastic and Deterministic Modeling
Explore the difference between stochastic and deterministic modeling through programming. First have the class write algorithms for relatively simple tasks using pseudocode. Use the Python 2.7 program app to simulate Mendel's Pea Pod...


