Curated OER
Graphs and Functions
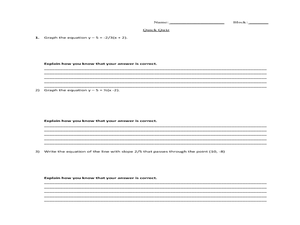
Middle schoolers describe plotting functions on the Cartesian coordinate plane. They solve functions on paper and using an online tool to plot points on a Cartesian coordinate plane creating lines and parabolas.
EngageNY
Vectors and the Equation of a Line
Represent linear equations in both two and three dimensions using parametric equations. Learners write parametric equations for linear equations in both two and three variables. They graph and convert the parametric equations to...
Curated OER
Convert Standard Form to Slope-Intercept Form
Ninth graders convert between the standard form of an equation and the y-intercept form. For this algebra lesson, 9th graders rewrite equations from their standard form into the y=mx + b form. They solve for y using the distributive...
Curated OER
Graphing Standard Form Inequality
Young scholars solve equations and graph it. In this algebra instructional activity, students solve inequalities and rewrite them in the slope intercept form. They graph the boundary lines first either as dashed or solid and shade the...
Curated OER
Slope, slope-Intercept Form and Standard Form
Students investigate and solve linear equations using slopes. In this algebra activity, students graph lines using the slope and y intercept. They also find the slope by rewriting their equation in to slope-intercept form from standard...
Curated OER
Do Two Points Always Determine a Linear Function II?
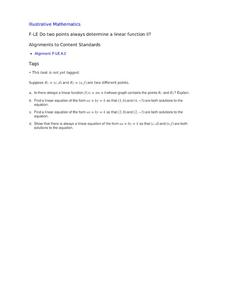
Learners analyze the difference between the slope intercept and standard forms of a line in this task. Given two general points using letters they explore linear functions and linear equations.
Curated OER
Graphing in an Experimental Context
Seventh graders discuss the importance of being able to represent scientific data in the form of graphs. They comprehend the differences between a bar graph and a line graph. Students identify the type of data with which each graph...
Curated OER
Angles Formed By Parallel Lines
Young scholars explore the concept of angles formed by parallel lines.They graph two parallel lines cut by a transversal, then measure the angles formed by the transversal and record the data in a table. Learners make conjectures about...
Curated OER
Introducing y = mx + b
Middle and high schoolers use the slope intercept form to graph a line. In this algebra lesson, pupils rewrite equations from standard form to y-intercept form. They use the slope and y-intercept to graph a line without making a table of...
Curated OER
Slopes, Slope-Intercept Form, Standard Form
Students identify the slope of an equation using various methods. In this algebra lesson, students graph linear equations and calculate the slopes using the x and y intercept to solve the equations and graph the lines. They use the slope...
Curated OER
Investigating Equations of Lines
High schoolers investigate linear equations as they use technology (Cabri, Jr.) to explore the equations of lines in slope-intercept form. The technology allows learners to manipulate the line and observe the changes in the parameters of...
Curated OER
Graphing My Path to Success
Seventh graders examine their school performance through self-assessment of strengths and weaknesses. They construct a line graph, plotting all courses and achievements. Students use graph paper and colored pencils for each activity. If...
Curated OER
How Long Can You Go?
Eighth graders examine the usefulness of a line of best fit by collecting and graphing data, using a graphing calculator to determine the line of best fit, and making a variety of predictions. They watch a video, then design a...
Curated OER
Profitable Soda Stand
Am I making any money? Help learners determine if their fictitious soda stand is turning a profit. They graph linear equations using the slope and y-intercept and identify the best price to use to sell soda. They identify the domain and...
Curated OER
Polar Graphs
Young scholars graph polar graphs. In this calculus lesson plan, students convert between polar and rectangular coordinates. They graph their solution on the TI calculator and make observations.
Curated OER
Investigating the Slopes of Parallel and Perpendicular Lines
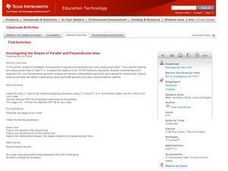
High schoolers investigate parallel and perpendicular lines. They use Cabri Jr. to construct and explore the relationships between the slopes of parallel and perpendicular lines. The drawing and measurement tools available with Cabri Jr....
Utah Education Network (UEN)
Linear Graphs Using Proportions and Rates
Using a TI-73 or other similar graphing calculator middle school math majors investigate the linear relationship of equivalent proportions. After a brief introduction by the teacher, class members participate in a timed pair share...
Curated OER
Lines in the Coordinate Plane
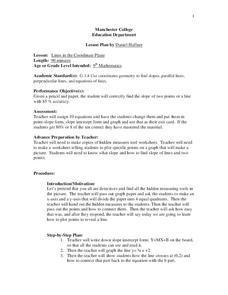
Students graph lines in a coordinate plane. In this geometry lesson, students graph lines on a coordinate plane, and identify the slope. They classify the lines as parallel or perpendicular and write an equation of a given line.
Curated OER
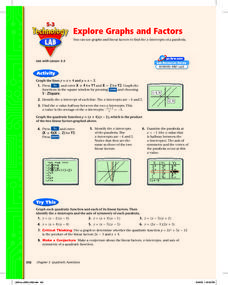
Explore Graphs and Factors
Pupils graph the factors of a quadratic as linear equations and graph the parabolic equation in factored form. Also, they investigate the relationship between the x-intercepts of the lines and the zeros of the parabola.
Curated OER
Linear Modelling of the Life Expectancy of Canadians
Middle and high schoolers explore the concept of linear modelling. In this linear modelling lesson, pupils find the line of best fit for life expectancy data of Canadians. They compare life expectancies of men and women, and find...
Curated OER
Modeling Linear Relationships
Students graph lines using the slope and y-intercept. In this algebra lesson, students create data using tables and equations. They use their data to make predictions and draw conclusion.
Curated OER
Line & Scatter (What Would You Use: Part 2)
Young scholars discuss line graphs and scatter plots and the best situations in which to use them. Using the graphs, they determine the type of correlation between variables on a scatterplot. They create a scatterplot and line graph...
Curated OER
What is the Average Height of Your Class?
For this statistics lesson, learners use an on-line form generator create a class-specific form, then complete the form, view a graph and data analysis, and draw conclusions.
Curated OER
Graphing Linear Equations with Two Variables
Can your class solve linear equations in two variables? They will be able to after they engage in this lesson. Individuals graph linear equations in two variables using slope and intercept and identifying the relationship between the x...


