Illustrative Mathematics
Weather Graph Data
Teaching young mathematicians about collecting and analyzing data allows for a variety of fun and engaging activities. Here, children observe the weather every day for a month, recording their observations in the form of a bar graph....
Curated OER
Weather instruments
Students explore weather instruments. In this weather lesson, students make rain gauges, anemometers, and barometers following the instructions given in the lesson. Students set up a weather station using their instruments and record and...
Montana State University
What's the Weather?
How many jackets do you need to stay warm and climb Mount Everest? An informatie resource covers the topic of Mount Everest, the resource helps young scientists discover the difference between climate and weather. Activities include...
Chicago Botanic Garden
Plant Phenology Data Analysis
Studying data over time can paint a pretty interesting picture. Learners use data they collected in the previous instructional activity to compare to historical data in a similar region. They graph the data of the first bloom of a...
Chicago Botanic Garden
Historical Climate Cycles
What better way to make predictions about future weather and climate patterns than with actual climate data from the past? Young climatologists analyze data from 400,000 to 10,000 years ago to determine if climate has changed over...
Curated OER
Cold, Clouds, and Snowflakes
Students explore satellite data and graphing. In this weather data analysis math and science lesson, students analyze NASA satellite data to draw conclusions about geographical areas where precipitation might have happened. Students...
Curated OER
Weather, Data, Graphs and Maps
Students collect data on the weather, graph and analyze it. In this algebra lesson plan, students interpret maps and are able to better plan their days based on the weather reading. They make predictions based on the type of clouds they...
Curated OER
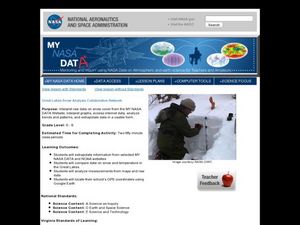
Great Lakes Snow Analysis Collaborative Network
Learners interpret data on snow cover and analyze trend patterns. In this snow lesson plan students compare data and locate their school's GPS coordinates.
Curated OER
Creating Climographs
Students use satellite data to compare precipitation and surface temperatures on different islands. In this satellite lesson students create graphs and explain the differences between weather and climate.
Curated OER
Have You Looked Outside? Lesson #5- Graphing Weather Conditions
First graders study daily weather changes. In this weather and graphing lesson, 1st graders chart the daily weather for a month using stickers or weather symbols. They graph the weekly weather so that at the end of the month students...
Radford University
A Change in the Weather
Explore the power of mathematics through this two-week statistics unit. Pupils learn about several climate-related issues and complete surveys that communicate their perceptions. They graph both univariate and bivariate data and use...
Curated OER
Current Weather
A great year around activity that shows young mathematicians how the math skills they are learning are actually used in the real world. This exercise also helps learners begin to distinguish the difference between weather and climate. As...
Curated OER
2nd Grade - Act. 28: Calendar & Weather Book
Second graders will track the weather patterns throughout the school year. This project spans the school year and takes five minutes per day or less. Measuring, data collection, and predictions are all explored throughout this relevant...
Curated OER
Wind Effects- A Case Study
Students explore hurricanes. In this weather data interpretation lesson, students draw conclusions about the impact of Hurricane Floyd as it related to weather conditions. Students read and interpret a tide data table, a barometric...
Curated OER
Weather Pals
Students study maps of the United States to locate weather pals from a list of schools. They communicate with Weather Pal schools through the use of closed circuit TV. Using weather data collected in their area, they exchange the...
Curated OER
Weather Report Chart
Students complete a weather report chart after studying weather patterns for a period of time. In this weather report lesson, students measure temperature, precipitation, cloud cover, wind speed, and wind direction for a month. Students...
Curated OER
The Weather Around Us
First graders explore weather patterns. In this weather lesson, 1st graders research the daily weather by creating a graph of the daily weather conditions. Students use the computer to access information regarding the weather forecast....
Curated OER
Is Grandpa Right, Were Winters Colder When He Was a Boy?
Students compare current weather data to historic data to see if there is a temperature change. In this weather lesson students complete a lab activity and determine average changes in temperature, precipitation and cloud cover.
Curated OER
Creating a Thematic Map
Students create and analyze a weather-related data table and a thematic map based upon information provided.
Curated OER
Rainbows, Bridges & Weather, Oh My!
Explore how real-world applications can be parabolic in nature and how to find quadratic functions that best fit data. A number of different examples of modeling parabolas are explored including a student scavenger hunt, the exploration...
Curated OER
Temperature Bar Graph
Students explore mean, median and mode. In this math lesson, students analyze temperature data and figure the mean, median, and mode of the data. Students graph the data in a bar graph.
NOAA
Climographs
In the second lesson plan of a five-part series, young climatologists use provided temperature and precipitation data to create climographs of three different cities. They then analyze these climographs to develop a general...
Curated OER
Data Analysis and Measurement: Ahead, Above the Clouds
Students explore and discuss hurricanes, and examine how meteorologists, weather officers, and NASA researchers use measurement and data analysis to predict severe weather. They plot points on coordinate map, classify hurricanes...
Curated OER
Trends of Snow Cover and Temperature in Alaska
Students gather historical snow cover and temperature data from the MY NASA DATA Web site. They compare this data to data gathered using ground measurements from the ALISON Web site for Shageluk Lake. They graph both sets of data and...


