Curated OER
Black Out
Students collect and analyze data. In this statistics lesson plan, students plot their data on a coordinate plane and find the line of best fit. They calculate the linear regression using the data.
Curated OER
Celsius to Fahrenheit
Students convert degrees between two different units. In this algebra lesson plan, students graph linear equations and identify the line of best fit. They use their line of best fit to make predictions given a set of data.
Virginia Department of Education
Exponential Modeling
Investigate exponential growth and decay. A set of six activities has pupils collecting and researching data in a variety of situations involving exponential relationships. They model these situations with exponential functions and solve...
Curated OER
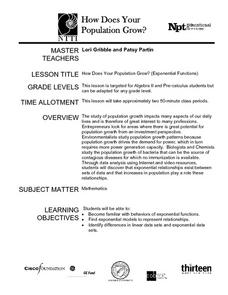
How Does Your Population Grown?
Do you know how the population has grown of your community? Can you predict the population over the next half century? Can we find an algebraic model that matches our data? These along with many more questions can be researched by...
Texas Instruments
TI-Nspire™ CAS
When it comes to rating educational calculators, this calculator is always near the top of this list. Now it's available as an app. There is a lot of calculator power wrapped up in this app. Not only is this a fully functioning...
Texas Instruments
TI-Nspire™
We landed on the moon with less computing capabilities than you can find in this app! Here is a multiple function calculator that takes all the power you get from a handheld and adds the wonderful large screen that only a tablet can...
EngageNY
Graphs of Quadratic Functions
How high is too high for a belly flop? Learners analyze data to model the world record belly flop using a quadratic equation. They create a graph and analyze the key features and apply them to the context of the video.
Kenan Fellows
How Does an Unhealthy Diet Influence our Health and Well-Being?
You are what you eat, or so they say! After surveying family and friends on a week of eating habits, learners analyze the data for patterns. They compare different variables such as fats and cost, fats and calories, or fats and LDLs.
Curated OER
Polynomial Functions
Students explore polynomial functions. In this Algebra II lesson, students explore graphs of polynomial functions as classify the functions as linear, quadratic, cubic, or quartic. Students determine the regression equation for each...
Curated OER
What's The Point?
Students solve word problems using the correct math symbols. In this algebra lesson, students use the TI calculator to graph their equation and analyze it. They find the line of regression and use to draw conclusion.
Curated OER
Relating Distance and Velocity Over Time
Learners calculate the distance and velocity over time. In this algebra lesson plan, students graph a linear function to represent the distance vers time travel. They interpret their graphs and draw conclusion.
Texas Instruments
Golden Ratio Lab
Learners investigate the Golden Ratio in this algebra I or geometry activity. They explore the Golden Ratio as the conduct an experiment in which they collect various measurement from their team members and find the regression equations...
Curated OER
Means of Growth
Students collect and graph data. In this statistics lesson, students analyze their plotted data using a scatter plot. They identify lines as having positive, negative or no correlation.
Mathalicious
Pic Me!
Finally! Math and Instagram have come together to discuss the correlation between likes and followers. High schoolers can't help but want to discover what makes one account more popular than another by developing a line of best fit and...
Mathematics Vision Project
Module 9: Modeling Data
How many different ways can you model data? Scholars learn several in the final module in a series of nine. Learners model data with dot plots, box plots, histograms, and scatter plots. They also analyze the data based on the data...
Curated OER
How Long Can You Go?
Eighth graders examine the usefulness of a line of best fit by collecting and graphing data, using a graphing calculator to determine the line of best fit, and making a variety of predictions. They watch a video, then design a...
Curated OER
Why Doesn't My New Shirt Fit?
High schoolers test Leonardo da Vinci's view of the human body by measuring various body parts using a tape measure. They create a data table and a scatter plot and then analyze and interpret the results using a graphing calculator.
Curated OER
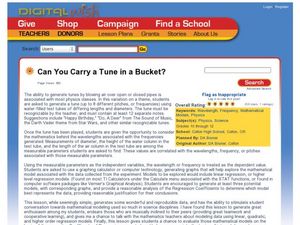
Can You Carry a Tune in a Bucket?
Students use water filled pipes to play a tune and consider the mathematics behind the sound waves. In this sound wave instructional activity, students play a tune with water filled pipes. They create a mathematical model to evaluate the...
Curated OER
Rational Numbers
Young scholars investigate rational numbers in this algebra lesson. They graph systems of equations and use technology to find the point of intersection. They need a TI for this assignment.
Curated OER
A Closer Look: Unemployment
Students view a video clip about unemployment. They research data and create a scatter plot graph. They discover the importance of graphs and what they can tell us. They create their own publication on unemployment.
Curated OER
Is the Slope Legal?
Learners define parallel and perpendicular lines. For this algebra lesson, students relate the concept of parallel and perpendicular lines to the real world. They classify the lines based on their slopes.
Curated OER
Logarithmic Transformations of Data
Students investigate and study logarithmic equations. In this precalculus lesson, students analyze the data behind the function. They define each graph as positive, negative or no correlation. They find the line of best fit.
Curated OER
The Swinging Pendulum
Students observe a pendulum and graph their observation. In this algebra lesson, students use the TI calcualtor to graph the motion the pendulum makes. They analyze the graph and make predictions.
Curated OER
Hot Wheels
Students observe the action produced by toy cars. In this geometry lesson, students discuss motion and distance as they relate to the movement of a spherical object.They collect data and make conjectures based on their data.
Other popular searches
- Linear Regression Us Census
- Algebra Linear Regressions
- Linear Regression Excel
- Statistics Linear Regression
- Non Linear Regression
- Linear Regression Census
- Linear Regression Ti83
- Linear Regression Calories
- Linear Regression Analysis


