Curated OER
Between The Extremes
Students analyze graphs for specific properties. In this algebra lesson, students solve equations and graph using the TI calculator. They find the different changes that occur in each graph,including maximum and minimum.
Curated OER
Tune...Um!
Students collect real data on sound. In this algebra lesson, students use a CBL and graphing calculator to observe the graph created by sound waves. They draw conclusion about the frequency of sound from the graph.
Curated OER
The Binary Counter Circuit
Students count from 0-99 using the binary number system. In this algebra instructional activity, students problem solve by working with faulty circuits and applying their knowledge f Binary Numbers. They work in team to create a solution.
Curated OER
Cruising the Internet
Students identify the parts of an engine using a graph. For this statistics lesson, students make a graph from their collected data. They calculate the volume of a cylinder using a line of regression and a scatter plot.
Curated OER
Shell Sort; Serving up Seafood
Students complete various small group activities to classify items and determine the types of combinations that can be made with these items. In the second lesson, students create menus for a restaurant to help them gain money sense and...
Curated OER
Habitats: Rainforest
Students use the internet to find reasons the rainforest is endangered and ways that affects the rest of the world. They read for information, perform experiments, locate rainforests on maps, and write about this ecosystem.
Curated OER
Mathematical Proofs
Students explore the nature of mathematical proofs and mathematical inquiry. They complete the activity "Using the Pythagorean Theorem". They read selected articles and participate in class discussions.
Curated OER
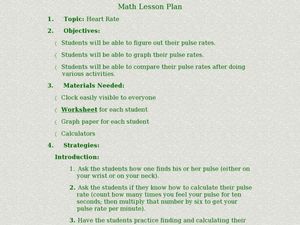
Graphing Heart Rates
Students explore heart rates. They record pulse rates, predict which exercises cause a faster heart rate, make a chart, and graph the results. Students write an essay using the data to support their predictions. They write a hypothesis...
Curated OER
Learning Inference
Making inferences can be a tricky proposition for middle schoolers. In the lesson presented here, pupils practice the skill of drawing a conclusion and making a judgment - which are what making an inference is all about! There are five...
Curated OER
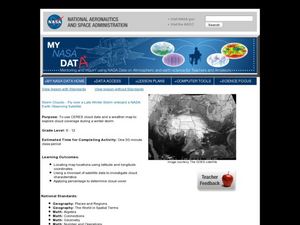
Storm Clouds-- Fly over a Late Winter Storm onboard a NASA Earth Observing Satellite
Students study cloud data and weather maps to explore cloud activity. In this cloud data lesson students locate latitude and longitude coordinates and determine cloud cover percentages.
Curated OER
Radiation Comparison Before and After 9-11
Using the NASA website, class members try to determine if changes could be detected in cloud cover, temperature, and/or radiation measurements due to the lack of contrails that resulted from the halt in air traffic after the attacks of...
Curated OER
Free Enterprise -- Product Cost
Students are introduced to the concept of free enterprise. In groups, they discuss the price of various food items and decide on which item to produce. They calculate the cost of producing the item and share their results with the class.
Curated OER
Archimedes' Principle of buoyancy
Learners use the internet to research Archimedes' principle of buoyancy. In groups, they summarize the principle and share it with the class. They also participate in experiments in which they test the principle and share their results...
Curated OER
Seasons and Cloud Cover, Are They Related?
Students use NASA satellite data to see cloud cover over Africa. In this seasons instructional activity students access data and import it into Excel.
Curated OER
Does Cloud Type Affect Rainfall?
Student uses MY NASA DATA to obtain precipitation and cloud type data. They create graphs of data within MY NASA DATA. They compare different cloud types as well as precipitation types. They describe graphs of the precipitation and cloud...
Curated OER
Introducing Temperature Measurement
Learners explore temperature and use Celcius thermometers to measure and graph the temperature in the classroom daily. They estimate what they think the temperature might be and then find the actual temperature in the room.
Curated OER
Understanding Cloud Formation
Learners view a demonstration that simulates cloud formation. They read a poem about clouds, participate in a class demonstration using warm water and ice and write a paragraph summarizing their observations.
Curated OER
Concrete Canoes
Young scholars explore and analyze the relationship of buoyancy and displacement needed to make an object float. They examine various boat designs, then design and build clay and aluminum boats that hold a cargo of marbles.
Curated OER
Thunderstorms
Fourth graders examine the attraction between two different charges to investigate lightning in a thunderstorm. They complete an experiment and a worksheet.
Curated OER
Graphing Data - Temperature
Seventh graders measure and record temperature over a given time period. They compare the recorded temperatures to the 40-year recorded normal average temperatures for the same area. Students display and interpret their findings in a graph.
Curated OER
What is a Cloud
Third graders study clouds and how they are formed. They write acrostic poems about clouds and analyze and graph temperature data collected during varying degrees of cloud cover.
Curated OER
Cloud Shadows
Students classify clouds as transparent, translucent or opaque. They conduct an experiment to determine the visual opacity of several classroom objects and then conduct further observations of clouds.
Curated OER
Cloud Observation and Graphing
Students identify the three major cloud groups. They are introduced to the three main cloud types and spend a week making and recording observations of clouds. Students produce a graph that presents their findings and conduct research...
Curated OER
Creating a Thematic Map Using S'COOL Data
Students observe weather patterns, collect data, and make a weather predictions for various locations on a map.
Other popular searches
- Logical Reasoning in Math
- Logical Reasoning Math
- Math Logical Reasoning 5th
- Logical Reasoning Math Venn


