Curated OER
Maximum Power Point
Students investigate how to optimize the power output of a photovoltaic cell using a home-made gnomon stand. They use data collected to create current-voltage and power-voltage curves and determine the "maximum power point," (MPP) at...
Curated OER
Maximum Power Point
Students investigate energy using a photovoltaic cell. In this electricity lesson, students collect data from current-voltage and power-voltage curves to determine if photovoltaic systems have an advantage over conventional electric...
Curated OER
Multiplying Exponents vs. Powers of Powers
Use the power of a power property to solve exponential functions. The lesson refers to differentiating between multiplying or adding exponents to find the value, and how to find the product of a power of a power.
National Nanotechnology Infrastructure Network
Jell-O® Waveguide and Power Loss
Jell-O® can help model the transmission of light through fiber optic cables. Young scientists use the jiggly dessert to make a waveguide to transmit a laser beam from one point to another. Their models help them learn the function of...
Bowels Physics
Work, Energy, and Power
Work, energy, and their relationship to power: what is the common thread? Explore this with your class as they learn the concepts of work and energy, both kinetic and potential, before completing multiple practice problems to demonstrate...
Curated OER
What is a Sound?
Second graders explore the concept of sound. In this sound lesson, 2nd graders discover what sound, vibrations, and pitch are through several experiments. Students watch a Power Point presentation that allows them to complete a graphic...
Curated OER
Maximum Power Point
Students investigate how to optimize the power output of a photovoltaic cell using a home-made gnomon stand. They use data collected to create current-voltage and power-voltage curves to determine the "maximum PowerPoint," (MPP) at which...
Curated OER
Dependence of Light Intensity on Distance
Hopefully you have a sensor interface for your physics class to use with graphing calculators when collecting data with a light sensor. If so, read on. Use this resource for learners to predict and then test whether or not the intensity...
Curated OER
Cell Works
Students observe slides of cork cells and discuss the use of microscopes. They view a power point presentation on "Looking Inside Cells" and take notes aligned with the PPT presentation. They collaborate with a partner to create an...
Curated OER
Energy Transformations
Students investigate energy transformation in the form of wind energy. They read a handout, answer questions, identify points in an energy system where transformations occur, and build a wind turbine.
Curated OER
Density - An Intrinsic Property
Learners discover the property of density while participating in a lab exercise. In this scientific measuring lesson, pupils utilize a scale to measure the density of different metal materials. They document their work and present their...
Curated OER
Get My Point!
Here is one of the better lessons I've come across on how to teach fractions and decimals. This lesson does a great job of showing how these two mathematical representations of numbers are interrelated. Some excellent websites, printable...
EngageNY
Modeling Riverbeds with Polynomials (part 2)
Examine the power of technology while modeling with polynomial functions. Using the website wolfram alpha, learners develop a polynomial function to model the shape of a riverbed. Ultimately, they determine the flow rate through the river.
Curated OER
Presenting Powerful Outlines for Science Fair Reports
Students examine and reflect on the role of science reports in the larger scientific community and become familiar with one scientist's experience preparing a report. They identify key points to build a strong science report and create a...
Curated OER
Describing the Motion of a Battery Powered Cars
Students explore distance a toy car travels by changing the amount of batteries used to power the toy car. In this force and motion lesson, students calculate the average speed of a car while investigating the power from various amounts...
Curated OER
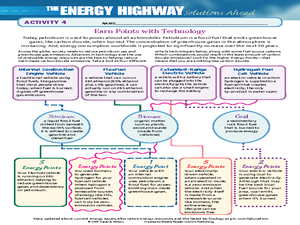
Earn Points with Technology
Students explore renewable energy by analyzing a diagram. In this fossil fuel activity, students view a chart explaining the different energy consumption from automobiles and how they impact our environment. Students analyze a point...
Curated OER
The Power Steering Is Out?
Students use the point slope formula to calculate the slope and equation of a line. In this algebra lesson plan, students identify point on a coordinate plane using a robot. They differentiate between the different quadrants a they...
Curated OER
Naturally Disastrous!
Learners explore, research and examine the causes of natural disasters and how to survive them. They research on the internet world climate, recent disasters, how they happen, what to do if one occurs and what preventive measures to take...
Curated OER
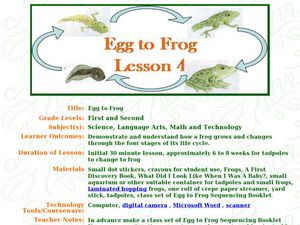
Egg to Frog
Learners study the life cycle of the frog. In this life cycle lesson set, students listen to a read aloud of Frogs, A First Discovery Book, and make a sequencing booklet that shows the four stages of the frogs life cycle. They observe...
Stanford University
Women in the 1950s
Students learn about suburban communities in the 1950s. In this women studies lesson, students watch a Power Point presentation about suburban communities in the 1950s. Students look at images from the 1950s and discuss what they think...
Curated OER
Measures of Central Tendency
Students analyze data using central tendencies. In this statistics instructional activity, students collect and analyze data using the mean, median and mode. They create a power point representing the different measures of central tendency.
Curated OER
Power of a Point
Students solve problems by finding the radius or diameter. For this geometry lesson, students identify the tangent line of a circle and use properties of circles to find the radius. They relate circles to the real world.
Curated OER
Simple Machines - Graphics, Experiments, Animation
Twelfth graders display simple machines through the use of graphics, experiments, and animation. They apply problem solving and design and skills.
National History Day
Propaganda Posters of World War I: Analyzing the Methods Behind the Images
The power of a picture. During the events surrounding World War I, propaganda posters were widely distributed in American society to sway the emotions of its citizens. By analyzing World War I propaganda posters in the first installment...
Other popular searches
- Power Point Autobiography
- Power Point Peer Pressure
- Power Points Aztecs
- Characterization Power Point
- Isaac Newton Power Point
- Marine Biology Power Points
- Prehistory Power Point
- Forensic Science Power Point
- Power Point Presentations
- Power Point Lesson Plans
- Power Point Science Safety
- Power Point Fairy Tale


