Curated OER
Graphs and Data
Students investigate poverty using graphs. In this algebra lesson, students collect data on the effects of poverty and use different rules to analyze the data. They graph and use the trapezoid rule to interpret the data.
Kenan Fellows
Attack of the Aphids!
Insects threaten the food production industry, and aphids are one of the big players! Analyzing data of aphid populations gives insight into their behaviors. Learners model the population data of an uninhibited population with an...
Curated OER
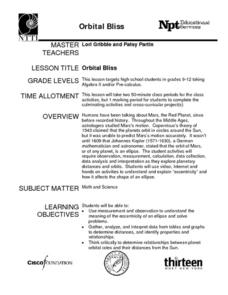
Orbital Bliss
Most young mathematicians are aware that the planets don’t orbit the sun in a circle but rather as an ellipse, but have never studied this interesting feature. This resource looks at the planetary orbits in more detail and helps learners...
Curated OER
Unit Circle Triangle
Students find the different ratios of a right triangle. In this geometry lesson, students apply the concept of the Pythagorean theorem as they identify the different angles and parts of a Unit Circle. They find the ratios of sine,...


