Statistics Education Web
When 95% Accurate Isn’t
Investigate the effect of false positives on probability calculation with an activity that asks scholars to collect simulated data generated by a calculator. To finish, participants analyze the probability of certain outcomes which lead...
EngageNY
Events and Venn Diagrams
Time for statistics and learning to overlap! Learners examine Venn Diagrams as a means to organize data. They then use the diagrams to calculate simple and compound probabilities.
NY Learns
Investigation - What's in the Bag?
If you have or can create a set of tiles, numbered one through eight, then you can implement this hands-on lesson about probability models. Individuals draw a tile from a bag, record its number, and then return it to the bag. They...
Texas Instruments
Probability of Repeated Independent Events
Statisticians analyze different samples to find independent and dependent events. In this probability lesson, pupils predict the outcome and then calculate the real outcome. They create a tree diagram to help predict the probability of...
Curated OER
Probability and Expected Value
Learners collect data and analyze it. In this statistics lesson, students make predictions using different outcomes of trials.
Curated OER
What are My Chances?
Students calculate the chance of an event occurring. In this statistics lesson, students use combination and permutation to calculate the probability of an event occurring. They differentiate between theoretical and experimental...
Curated OER
What's in the Bag?
Students calculate the probability of an event occurring. In this statistics lesson, students calculate the outcome using combination and permutation. They differentiate between-theoretical and experimental probability.
Virginia Department of Education
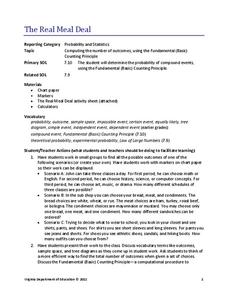
The Real Meal Deal
Burgers and salads and sodas, oh my! Scholars use a menu to investigate the Fundamental Counting Principle. They create tree diagrams to illustrate the number of possible choices for each given scenario.
Curated OER
How do We Treat Our Environment?
Seventh graders explore the concept of collecting data. In this data collection lesson, 7th graders survey others about their environmental habits. Students graph their data.


