Environmental Protection Agency (EPA)
How Much Water Do You Use?
Incorporate reading strategies, math, research, and the scientific method into one lesson about water conservation. After reading a story about a landlady trying to determine how many people are living in an apartment, learners develop a...
Curated OER
Data Collection - Primary Poster
Students explore the concept of collecting, analyzing, and graphing data. For this collecting, analyzing, and graphing data lesson, students create a survey about a topic of interest. Students poll their classmates, analyze, and graph...
Curated OER
Tallies Tell It All
Students explore data collection through the use of tally marks. After a demonstration of the use of tally marks students complete various inquires where they create a chart documenting the number of times a desired result happens. They...
Curated OER
Organizing Data
Third graders investigate ways to organize data. In this tally marking lesson plan, 3rd graders practice drawing tally marks to represent an item of data. Students also make connections with skip counting by fives.
Curated OER
Lessons for Atlatl Users with Some Experience-Grade 6
Sixth graders experiment with an atlatl and dart. In this sixth grade data management mathematics lesson, 6th graders explore and determine the most suitable methods of displaying data collected from their experimentation with...
Curated OER
Sound Walk: Discovering Data and Applying Range, Mode, and Mean
Elementary schoolers sharpen their listening skills as they use sound maps, tallies, and line plots to organize and interpret data. Everyone takes a "sound walk," and focuses on the sounds around them. They chart and tabulate the sounds...
Curated OER
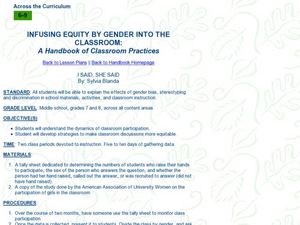
Gender Equity: I Said, She Said
Students collect and analyze data on classroom participation. In this gender equity lesson, students use tally marks to collect data on the sex and numbers of students who participate in classroom discussions. Students...
Curated OER
Frequency Words
First graders use a graph to answer questions about the frequency of words. Using rhymes, they fill in a chart about the data they collected. In groups, they use their word wall words to identify them in a book.
Curated OER
Taster/Non-taster Lab Activity
Pupils determine if they are tasters or non-tasters and then replicate the experiment with family and peer group members. They collect data from the experiment to determine which trait is dominant.
Curated OER
A Thanksgiving Survey
Students conduct a survey. In this math lesson plan, students design and conduct a survey about Thanksgiving foods. Students display the collected data in a graph and use the graph to determine what food to serve for a Thanksgiving meal.
Curated OER
Enhancing Writing Through Technology
Students participate in a class survey of their favorite activity to do in the snow and organize the results in a graph. They write a paragraph about the graph using language from a class-developed word web and include both an opening...
Curated OER
Water Cycle: Weather Lesson 1
First graders go on a water walk, collect weather data, and measure rainfall for a month. They examine the water cycle in this series of lessons.
Curated OER
Rice (Gohan) Observations
Second graders investigate rice or gohan as it's called in Japan in a couple of experiments. They tally the results.
Curated OER
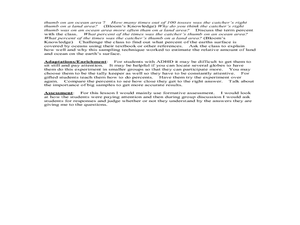
What Part of the Earth's Surface is Covered by Oceans?
Third graders investigate oceans. In this Earth science lesson, 3rd graders predict how much of the Earth's surface is covered by oceans. Students determine if their predictions are accurate by throwing a globe to...


