Earth Watch Institute
Entering Local Groundhog Data in an Excel Spreadsheet
Here is a cross-curricular ecology and technology lesson; your learners create spreadsheets depicting the location and number of groundhog dens in a local park. They research groundhogs and analyze data about where the groundhog...
Curated OER
Using a Spreadsheet to Understand Density
Students use density to identify what metal a gold colored weight is made of. They use a spreadsheet to graph the experimental density of common metals and compare the know densities to their calculated density of the known metal.
Curated OER
Using a spreadsheet and the Internet to learn about stock market performance
Students record the progress weekly of a business of their choice on the stock market, graph those results, research and report on current news and how it pertains to the companies recent performance.
Curated OER
Student News And Weather Channel
Fabulous! Your 5th graders should love this project. As an ongoing lesson throughout the year students use temperature probes to record outside temperature and then document their data using spreadsheets. They use their weather data and...
Curated OER
Math: Football Fever Fun
Students compile statistics from high school or other football team and construct a spreadsheet on which to record their findings. Using Chart Wizard to analyze the data, they construct charts and graphs for a visual display of the...
Curated OER
Measuring Rainfall and Relationships Between pH, Alkalinity and Suspended Solids in the Pago River
Eleventh graders test the pH and alkalinity of Pago River. In this ecology lesson, 11th graders collect data and use spreadsheet to graph results. They analyze and share their findings with the class.
Curated OER
Graphing Favorite Colors
Third graders collect data and insert it into ClarisWorks to create a spreadsheet/graph of their favorite color. They interpret the data together.
Curated OER
Global Warming Statistics
Students research real-time and historic temperature data of U.S. and world locations, and analyze the data using mean, median, and mode averages. They graph the data and draw conclusions by analyzing the data. A spreadsheet is used to...
Curated OER
Quick Concept Demonstrations
Students research the nervous system. Demonstrations on how to pick up keyed information in text is shown daily and weekly. Reviewed for content is Nerve Impulse, Polarization and Depolarization and perception. A spreadsheet will graph...
Curated OER
Fabulous Fossils
Seventh graders investigate how fossils are formed and discuss how scientists determine the appearance of ancient plants and animals. They make fossils of everyday objects for others to identify. They make spreadsheets to display fossil...
Curated OER
What Would it Cost You Today?
Learners explore inflation and the role played by advertising and marketing over the years. In this financial literacy lesson, students complete worksheets, do Internet research, and create an excel spreadsheet comparing prices from...
Curated OER
Personal / Group Magazine
Sixth graders complete the magazine template in the Macmillan "Writer's Journal" available through the basic skills department using word processing, spreadsheet, graphic, and electronic resource (i.e.-Internet) skills
Curated OER
Supermarket Smarts
Students examine how a consumer can make informed choices. They visit stores with a prepared shopping list, record the prices on a spreadsheet, create graphs, and create a Powerpoint presentation comparing the total cost of stores and a...
Curated OER
Around and Around
Students create a spreadsheet to record information about circular objects. They measure and record information from a variety of objects. Students calculate the ratio of the circumference to the diameter of each object. They find the...
Curated OER
Have Fun With Technical Report Writing
Students use Clarisworks Word Processing and Spreadsheet, Quick-Take Camera and Software, and produce a publishable technical paper.
Curated OER
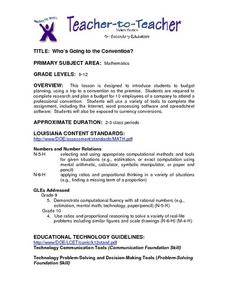
Who's Going to the Convention?
Students practice planning budgets as they create a budget for ten employees of a company to attend a professional convention. They use the Internet, and spreadsheet software to complete their assignment.
Curated OER
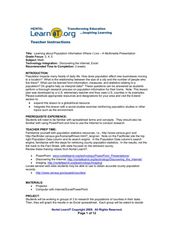
Learning and Population Information - Where I Live
Students study their county populations in a multimedia presentation format. In this populations lesson, students work in groups of 3 to research the county populations in their state. Students chart their results in an Excel document...
Curated OER
Time Management
Students plot activities for a 24 hour day. They record their information on a spread sheet program. Students list categories they use and write equations for cells that add cells of each category together. Students create a pie chart of...
Curated OER
There's No Accountin with Ledgers
Tenth graders create and maintain a ledger, write an essay for the process, and learn to keep financial accounts through the ledger. In this ledger instructional activity, 10th graders define an accounting ledger and create one for the...
Curated OER
Teaching about Data Interpretation
Students explore a variety of relevant lake water chemistry questions, compose responses, and present their results in a poster format. They, in pairs, answer questions about lake chemistry which are imbedded in this plan.
Curated OER
Phenomenal Weather-Related Statistics
Eighth graders research, collect and interpret data about weather statistics. They record that data on spreadsheets. they create Powerpoint presentations on their individual or group research.
Curated OER
Slopes, Hopes, & Speed
Students investigate the sport of skiing through Internet research in this multi-task lesson. They compare and generalize the results of five individuals by using mean, median, and mode.
Curated OER
State Economy Chart
Fifth graders create a 3D Pie graph using the Chart Wizard in Excel to represent their assigned states' data. They discuss the similarities and differences between states, and form a hypothesis on the relationship between location and...
Curated OER
Drive-Thru Nutrition
Students research fat and calorie content of various food items at 12 popular fast-food restaurants. They compare the foods and create a day's worth of healthy menus using food from those restaurants.


