Radford University
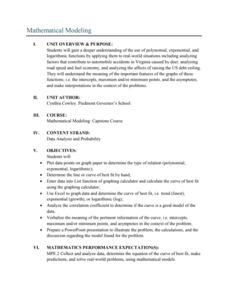
Mathematical Modeling: Lessons 2-3
Not all functions are created equal. Pupils apply regression analysis using polynomial, exponential, and logarithmic functions to investigate the relationship between variables and to decide which function would be best to model the...
Radford University
Mathematical Modeling: Lesson 1
Will more deer result in more big game licenses? Scholars first research data on the number of deer and the number of big game licenses in Virginia between 1990 to 2009. They apply polynomial, exponential, and logarithmic regression to...
Curated OER
Exponential Functions -- M&M Activity
Students receive cups and M & M candies. They perform an experiment to compare the graph of theoretical and experimental exponential growth. Students spill a pair of candies onto the table. They add candies for each "M" they see....
Radford University
Real World Data
Make math class feel more real by using real-world data. Scholars research or collect data on several different topics, such as nutrition, the motion of moving objects, cooling curves, and daylight hours. They create scatter plots using...
Radford University
Regression Analysis Activity
Don't let your knowledge of regression analysis regress. Pupils take part in three activities to learn about regression curves. They research and collect data to predict how long it will take a basketball to hit the ground, find a...
Curated OER
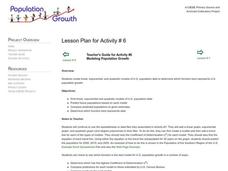
Modeling Population Growth
Students create linear, exponential, and quadratic models of U.S. population data to determine which function best represents U.S. population growth. They predict future populations based on each model.
Curated OER
Exploring Quadratic Equations
By stretching and translating the parabola given and determining the effects on the equation, students explore finding the vertex and zeros of a parabola and relate them to the equation. Students also view the intercept form to determine...
Curated OER
Industrialization, Chemicals and Human Health - Math
Students review the units of the metric system, and practice estimating measures before actually converting between the two systems of measurement. They participate in activities to visualize a concentration of one part per million....
Curated OER
The Good, The Bad, The Ugly
Sixth graders examine the causes of the stock market crash of 1929. For this integrated math/history unit on the stock market, 6th graders study, research, and read stocks, visit a local bank, and create a PowerPoint to show the...


