Curated OER
Reading Charts and Tables - Garden Spiders
Students complete chart and table reading activities to learn about garden spiders. In this chart and tables lesson, students view a video about garden spider varieties. Students name the different spiders and complete a spider garden...
Curated OER
The Mitten
Explore the Ukraine through a reading of The Mitten. Readers will determine the sequence of events, cause and effect, make predictions, and find the main idea of the story. They also use math skills to make charts and graphs. Finally,...
Curated OER
Who Represents You?
Young scholars investigate Congress and how individuals are represented in this Country. In this government lesson, students complete worksheets research government web sites to determine which senators and congressmen represent them....
Curated OER
Exploring Renewable Energy Through Graphs and Statistics
Ninth graders identify different sources of renewable and nonrenewable energy. In this math lesson plan, learners calculate their own carbon footprint based on the carbon dioxide they create daily. They use statistics to analyze data on...
Curated OER
A Nation of Nations Lesson Plan: Charting African Ethnicities in America
Students read a portion of the narrative, The Transatlantic Slave Trade, to explain the ethnic origins of enslaved Africans brought to the US. They create charts and bar graphs comparing ethnicities in the lowlands and tidewater regions.
Curated OER
Tables, Charts and Graphs
Students examine a science journal to develop an understanding of graphs in science. In this data analysis lesson, students read an article from the Natural Inquirer and discuss the meaning of the included graph. Students create a...
Curated OER
Graphing Family Reading Habits
Second graders collect data from their families about their reading habits and graph them. For this graphing family reading habits lesson, 2nd graders interview family members about their reading habits. They then use a graphing computer...
Curated OER
Then and Now
Students conduct research and use census data to compare different times and places. In this census lesson, students interpret data from charts and graphs, comparing census information from two time periods as well as from two different...
Fluence Learning
Writing About Informational Text: Everybody Can Bike
A three-part assessment challenges scholars to read informational texts in order to complete three tasks. Following a brief reading, class members take part in grand conversations, complete charts, and work in small groups to research...
Curated OER
Charts, Maps, and Graphs Lesson on the Holocaust
Students practice interpreting data. In this Holocaust lesson, students research selected Internet sources and examine charts, maps, and graphs regarding the Jewish populations in and out of Europe. Students respond to questions about...
Curated OER
What's Data?
Students get the opportunity to investigate the concept of data collecting. They explore how to tally and read a bar graph. Vocabulary about data is also be included. At the end of the instructional activity, individual students collect...
Curated OER
The Numbers Tell the Story
Students demonstrate how to gather and interpret statistical data. For this data analysis lesson, students search for statistics on the health effects of smoking and place the information into charts. Students create these charts online...
Curated OER
The Good, The Bad, The Ugly
Sixth graders examine the causes of the stock market crash of 1929. In this integrated math/history unit on the stock market, 6th graders study, research, and read stocks, visit a local bank, and create a PowerPoint to show the finished...
Curated OER
I Am Golden
Students become familiar with patterns, the Fibonacci Sequence, and the Golden Ratio. They see how many places these occur. They have practical applications for using the calculator and making charts to extend patterns.
Curated OER
Equadorian Rainforest: The Tropical Supermarket
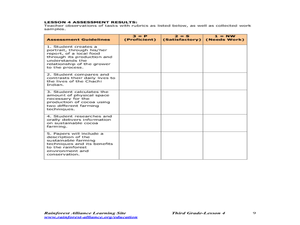
Young scholars study the concept of sustainable agricultural practices through cocoa farming and the lives of the people who are the producers. Students watch a slide show and read a story which helps them understand the origins of...
Curated OER
A Class Census
Students recognize that data represents specific pieces of information about real-world activities, such as the census. In this census lesson, students take a class and school-wide census and construct tally charts and bar graphs to...
Curated OER
Ornithology and Real World Science
Double click that mouse because you just found an amazing lesson! This cross-curricular Ornithology lesson incorporates literature, writing, reading informational text, data collection, scientific inquiry, Internet research, art, and...
Curated OER
Cold Enough?
Students read and record temperatures and display the data. They represent the temperatures on an appropriate graph and explain completely what was done and why it was done. Students display the data showing differences in the daily...
National Security Agency
Place Value for Primary Grades- A Place for Everything
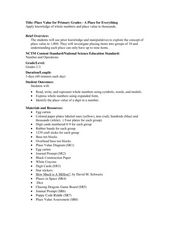
Here is a phenomenal instructional activity on place value to the thousands place. Learners construct numbers and identify the value of each digit, investigate building numbers using craft sticks and paper plates, and complete other...
Curated OER
Constitution/Impeachment/Reconstruction
Eleventh graders analyze a chart comparing U.S. census data from 1850, 1880, 1900, and 1920. They read a handout summarizing immigration legislation from 1882-1996 and create a graph charting how open / closed U.S. immigration is over time.
Curated OER
Investigating: Interpreting Graphs and Analyzing Data
Students explore statistics by researching class birthday data. In this data analysis instructional activity, students investigate the different birthdays among their classmates and create data tables based on the given information....
Curated OER
Waste Audit
Students engage in a lesson that is concerned with the concept of mental math. They perform calculations as following: recognizing a half, three quarters, and tenths. Students are also challenged to extend skills to making calculation...
Curated OER
Where In the World Are We?
Fifth graders read postcards and find their locations on maps. They use the pictures and text on the postcards to write about imaginary vacations. They compute the mileage and compare it to TripMaker data.
Curated OER
No New Workers Need Apply
Students explore older people's perspectives on work and retirement by creating charts to reflect statistical trends and formulate interview questions. They write follow-up articles that record and comment on the attitudes of their...


