Curated OER
Virus and Bacteriophage
Students examine the differences between a virus and a bacteriophage. They explore various websites, identify the parts of a virus and a bacteriophage, and construct a model of a virus or bacteriophage.
Curated OER
The Solar Cycle
Students research the solar cycle. In this Science lesson, students use the internet to investigate the solar cycle. Students produce a spreadsheet and graph from the information collected.
Curated OER
The Affect of Water Temperature on Living Organisms
Young scholars examine the environmental impact of global warming. For this environmental science lesson, students design and conduct an experiment about the effect of temperature on paramecia. They write a lab report about their...
Curated OER
Column Chromatography
Students research the mechanics of liquid chromatography. In this technology instructional activity, students calculate the concentration of unknown samples. They write a report about their research and lab results.
Curated OER
Altering a Plant Environment
Learners investigate what a controlled group is by creating an experiment. In this plant growth lesson, students identify the different parts of a plant and discuss what is needed for a plant to be successfully grown. Learners grow a...
Curated OER
Student Costs Graph
Students calculate the mileage, gasoline costs, and travel time and costs for a vacation. They conduct a virtual field trip, and create a comparison graph of costs using Microsoft Excel software.
Curated OER
Olympic Line Graphs
Sixth graders examine how to make line graphs. For this Olympic line graph lesson students make line graphs and search the given Internet sites to find data on their summer Olympic Game.
Curated OER
Chew on This
Eighth graders explore and demonstrate the seven steps of the scientific method. They predict how much sugar is in chewing gum and test, analyze, and calculate the sugar content of gum.
Curated OER
Aquatic Science and IPC
Students explain the importance of water in our daily lives. In this aquatic science lesson, students identify different ways to purify water and make it potable. They design and construct a water filter based on researched information.
Curated OER
Virtual Field Trip: Lodging and Meals
Students calculate the costs for lodging and meals for a virtual field trip. They calculate the number of nights lodging needed for road and city travel and the number of meals needed, the costs for each, and input the data using...
Curated OER
Dynamic River Model
Learners develop the concepts of flood stage, levees, floodplain, and the dynamics of river flooding. They construct river models and test various flow rates and volumes. This lesson has an excellent experiment for students to do.
Curated OER
Math: Will The Airplane Get Off the Ground?
High schoolers use data from real-life models to calculate and compare the force required for an airplane of a given weight to become airborne. They use a graphing calculator to evaluate data and use the World Wide Web to access data.
Curated OER
Get the Picture with Graphs
Fifth graders examine line, bar and circle graphs in the newspaper and on the Internet. They complete sketches of graphs with an emphasis on selecting the best model to depict the data collected.
Curated OER
Misleading Graphs
Students explore number relationships by participating in a data collection activity. For this statistics lesson, students participate in a role-play activitiy in which they own a scrap material storefront that must replenish its stock....
Curated OER
Color Enhanced Maps
Students download or create maps with numerical weather data. They add isolines and color to create regions on their maps. They explore the visual properties of color palettes and create a visualization applying their knowledge.
Curated OER
Rockets and Payloads
Students investigate Newton's Second Law of Motion as they predict the effect of a payload on the amount of energy needed to lift a rocket vertically. The constraints of the weight of the equipment carried to Mars is compared to the...
Curated OER
Where We Live
Students analyze Canada's population distribution. They access online information to gather demographic information about two Canadian cities. They compare and contrast the quality of life in the two cities and present their findings.
Curated OER
Creating a Bar Graph with a Graphing Program
Students use the S'COOL data base to create a bar graph.
Curated OER
Weather Proverbs
Students investigate various concepts related to weather. They conduct historical research to see how the study of weather originated and the application of the latest technologies in the field. Students summarize the information with...
Curated OER
Confusing Colors!
Fourth graders collect data, graph their data, and then make predictions based upon their findings. They's interest is maintained by the interesting way the data is collected. The data collection experiment is from the psychology work of...
Curated OER
Airspeed Problem Set
Students demonstrate an understanding of aircraft launch airspeed requirements. They read a selection on relative velocities from a NASA Web-based textbook, then calculate airspeed launch requirement problems.
Curated OER
Wing Area Effects Problem Set
Students read an explanation from a NASA Web-based textbook on lift and an explanation on the FoilSim software package given below. They use FoilSim to evaluate the relationship between wing area and lift.
Curated OER
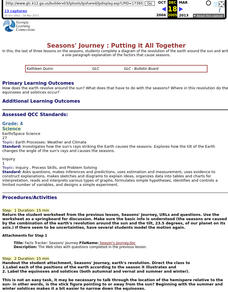
Seasons' Journey : Putting it All Together
Third graders complete a diagram of the revolution of the earth around the sun and write a one paragraph explanation of the factors that cause seasons.
Curated OER
Newton's Third Law and Aircraft Propulsion
Students research propulsion, graph data, and interpret the results.


