EngageNY
Modeling a Context from Data (part 2)
Forgive me, I regress. Building upon previous modeling activities, the class examines models using the regression function on a graphing calculator. They use the modeling process to interpret the context and to make predictions based...
Curated OER
Taxi!
Your young taxi drivers evaluate and articulate the reasoning behind statements in a conceptual task involving linear data. The given data table of distances traveled and the resulting fare in dollars is used by learners to explore...
Curated OER
Model and Solve Algebraic Equations
Examine multiple ways to solve algebraic equations. Pupils will generate a problem solving strategy that addresses the prompt given by the teacher. They will then share their problem solving strategy with the class. Graphic organizers,...
NOAA
Importance of Deep-Sea Ecosystems – How Diverse is That?
When judging diversity of an ecosystem, both species evenness and species richness must contribute. After a discussion of diversity and a guided example using the Shannon-Weaver function, scholars use the same function on two other...
Curated OER
Sandia Aerial Tram
Your learners analyze a table of real-life data in order to write an equation that best models the information. Exponential, quadratic, and linear rates of changes are all possibilities in this task.
Curated OER
Changing Planet: Melting Glaciers
Resource links to a video, satellite images, data, and photographs of glaciers provide emerging earth scientists the opportunity to examine how the ice has been retreating over the years. A data table is included for pupils to record...
EngageNY
Modeling a Context from a Verbal Description (part 1)
When complicated algebraic expressions are involved, it is sometimes easier to use a table or graph to model a context. The exercises in this lesson plan are designed for business applications and require complex algebraic expressions.
Curated OER
Glaciers: Then and Now
A large data table is given to your elementary earth scientists in which they record observations that they make while viewing pictures of Alaskan glaciers. They compare and contrast recent photos with older photos. Hold a discussion...
Carnegie Mellon University
Renewables Workshop
Youngsters examine resource maps to find out which states are using solar and wind power and discuss as a class various other renewable energy sources. They use a provided data table to record pros and cons to each technology, build and...
EngageNY
Conditional Relative Frequencies and Association
It is all relative, or is it all conditional? Using an exploration method, the class determines whether there is an association between gender and superpower wish through the use of calculating conditional relative frequencies. The last...
Virginia Department of Education
Growing Patterns and Sequences
Learners explore, discover, compare, and contrast arithmetic and geometric sequences in this collaborative, hands-on activity. They build and analyze growing patterns to distinguish which kind of sequence is represented by a set of data...
Towson University
Case of the Crown Jewels
Can your biology class crack the Case of the Crown Jewels? Junior forensics experts try their hands at DNA restriction analysis in an exciting lab activity. The lesson introduces the concept of restriction analysis, teaches pipetting and...
American Statistical Association
Spinners at the School Carnival (Equal Sections)
Spin to win a toy car. A fun activity has pupils use a spinner in which three of the equal sections represent winning a toy car, and the fourth section represents no car. They record the number of wins after certain numbers of spins,...
Curated OER
Effects of Temperature, Deviation on Climate
Students collect and record data for a given city. They calculate standard deviation of temperature and analyze the impact of climate changes on a city's and culture.
Curated OER
That's Predictable - Stream Side Science
Research the impact that changes in biotic or abiotic factors might have on an ecosystem. Debate for or against the changes and take action in the community. This resource ideally follows stream studies that young ecologists may have...
Curated OER
Build A Skittles Graph
Students explore graphing. In this graphing lesson, students sort Skittles candies and use the color groups to create a bar graph. Rubrics and extension activities are provided.
Virginia Department of Education
Normal Distributions
Pupils work to find probabilities by using areas under the normal curve. Groups work to calculate z-scores and solve real-world problems using the empirical rule or tables.
Serendip
How Do We Sense the Flavors of Food?
We taste with our taste buds, so why do flavors change when we have a stuffy nose? Scholars experiment with taste testing while holding their noses and then while smelling. They record their observations in pairs and come together to...
Curated OER
In the Billions and Linear Modeling
Your learners analyze population data to discern if it best fits a linear scenario. The idea of change by equal differences over equal intervals is enforced in this real-life task.
Virginia Department of Education
Quadratic Curve of Best Fit
Class members create a table of the number of chords that can be drawn given the number of points on a circle. Pupils analyze the data created, find a function to fit to it, and use the function to make further predictions.
Curated OER
US Population 1790-1860
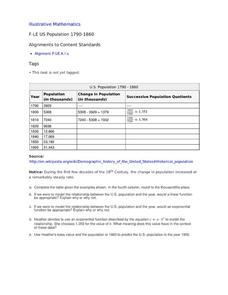
Your young population scientists analyze a table of values, write a model to represent the real life data, finish the table of data and predict future populations in a collaborative, real-life activity.
EngageNY
Relationships Between Two Numerical Variables
Is there another way to view whether the data is linear or not? Class members work alone and in pairs to create scatter plots in order to determine whether there is a linear pattern or not. The exit ticket provides a quick way to...
Curated OER
US Households
Learners construct and use inverse functions to model a real-world context. They use the inverse function to interpolate a data point.
Curated OER
In the Billions and Exponential Modeling
Modeling population growth gives learners an opportunity to experiment with real data. Comparing the growth rates in this real-life task strengthens learners' understanding that exponential functions change by equal factors over equal...
Other popular searches
- Data Tables
- Data Displays
- Displaying Data
- Create Data Table
- Data Table and Graph
- Creating Data Tables
- Science Data Tables
- Creating a Data Table
- Making Data Tables
- Organizing Data in Tables
- Solar System Data Table
- Data Tables and Graphing


