ESL Kid Stuff
Daily Routines & Times of the Day
What time do you eat breakfast? Or go to school? Language learners practice crafting and answering questions about their daily routines.
Curated OER
Using Excel to Draw a Best Fit Line
Middle schoolers create line graphs for given data in Microsoft Excel. Students follow step by step instructions on how to create their graph, including how to create a trend line. Middle schoolers print graphs without trend lines and...
Curated OER
Investing
Learners collect data on investments and draw conclusions. In this algebra lesson, students analyze exponential graphs as they relate to money. They discuss the cause of an account balance being high or low.
Curated OER
Finding Mean, Mode and Median in the Computer Lab
Young scholars create spreadsheets which will display and figure mean, median, and mode of a set of numbers.
Curated OER
Scale Basketball
Students understand that a spreadsheet can be used to find the best scale to use in a model. They place the distances of the planets of the solar system to the Sun in one column of the spreadsheet. Students try different scales so that...
Curated OER
Graphs and Spreadsheets
Students collect data and present it in a graph and/or a spreadsheet, depending on their previous understanding of technology.
Curated OER
Math Hunt
Students, in groups, explore their school to find examples of patterns, geometric shapes, and fractions. They take measurements and make computations of what they find. They record their findings in a spreadsheet, make graphs, and share...
Curated OER
Finding Patterns with the Hundreds Chart
Students review their numbers up to one hundred. Using a chart, they compare and predict patterns that might be in the numbers. They practice skip counting and grouping numbers. Using a spreadsheet, they graph different sets of numbers...
Curated OER
Money Math
Students explore the use of money in daily life. Through activities and real-life simulations, students write and balance a checkbook, explore the importance of budgeting, saving, and expenses. Using spreadsheet technology, they examine...
Curated OER
Comparing Temperatures in Different Cities
Students generate a spreadsheet to calculate average daily temperature. They create graphs from spreadsheet data and comprehend the components of the a spreadsheet.
Curated OER
Graphing With Second Graders
Second graders sort M & M's and then enter the data into a spreadsheet in order to create a simple graph. After printing the spreadsheet generated graph, have students compare the printed graph with their paper graph.
Curated OER
The Transformer
Fourth graders practice measuring different objects in inches. Individually, they estimate the length of the same object in centimeters and then calculate the actual length. They compare and contrast their estimate to the actual length...
Curated OER
Measuring Mania
Middle schoolers rotate through stations in the classroom, completing different types of measurements. These measurements are placed into a spreadsheet, and a scatter plot is generated. They type an explanation of their results in...
Curated OER
Electronic Spreadsheets & Iditarod 2000
Learners use the Internet for gathering information for Iditarod race journals. They use a spreadsheet program for entering data and making charts for showing changes in speeds achieved over a period of four weeks in timed writings in...
Curated OER
Graphing
Fifth graders create graphs based on climate in South Carolina. They read and interpret information in a chart and construct a graphy from the information in the chart. They create a spreadsheet using Excel and publish 2 graphs.
Curated OER
The Derivation of (Pi)
Seventh graders groups measure the diameter and circumference of each of the circular objects in the room. They record their results on their student worksheets and access a computer spreadsheet program to compile their results.
Curated OER
Entering Numbers 1 to 10, 1 to 20, 1 to 100
Students enter numerals on spreadsheet and use template to record numerals.
Curated OER
Which Color Will You Pick?
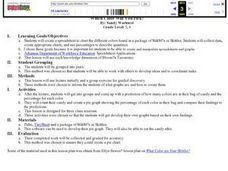
Students create a spreadsheet to chart the different colors found in a package of M&M's or Skittles. They collect data, create appropriate charts, and use percentages to describe quantities.
Curated OER
Strength Building
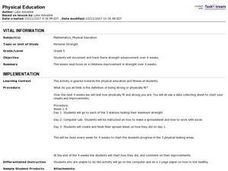
Fifth graders go to each of the 3 stations testing their maximum strength and then make a spreadsheet and how to work with excel. Students create and finish their spread sheet on how they did on day 1.
Curated OER
Running a Business
Students discuss spreadsheets and how they work. They then imagine they are owners of a store, determine twenty items that they would sell, and create spreadsheets to record amounts of each item sold in a two-week period. After entering...
Curated OER
Ladybugs in the Garden
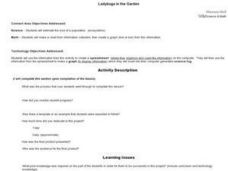
Fifth graders estimate the size a population (ecosystems) Students make a chart from information collected then create a graph (line or bar) from this information. Students do a lesson where they observed, examine, and record data...
Curated OER
Introduction to Computing and Project Development
Students use a computer and math to complete a science project. They review a brief history of computers as well as information on different operating formats will be included. In addition, students complete an overview of the hardware...
Curated OER
Rouge River Data
Students participate in using Excel sofware in order to create graphs. They create the graphs using data that they gathered during the Rouge River Field Trip they attended. The produce bar graphs from the excel spreadsheets.
Curated OER
Learning About Graphics
Students practice using and filling in a spreadsheet. They also create graphs and charts that coorespond with the data. This is a unit comprised of four lesson plans.
Other popular searches
- Spreadsheets
- Excel Spreadsheets
- Budget Spreadsheet
- Favorite Foods Spreadsheet
- Microsoft Excel Spreadsheets
- Candy Wrapper Spreadsheet
- Basic Spreadsheet Skills
- Spreadsheet Lesson Plans
- Meteorology and Spreadsheets
- Using Excel Spreadsheets
- Amusement Park Spreadsheet
- Creating a Spreadsheet


