Utah Education Network (UEN)
The Human Line Plot
Learners collect data and use charts and line plots to graph the data. Some excellent worksheets and activities are embedded in this fine lesson on line plots.
Curated OER
Halloween Point Plot
Practice graphing and plotting points with a festive Halloween flair! Scholars plot 21 points on a grid, connecting them to create a spooky shape!
Soft Schools
Plot — 3rd or 4th Grade
After reading a version of "The Tortoise and the Hare," scholars complete a plot diagram. They pinpoint the tale's beginning, rising action, climax, falling action, and ending.
National Security Agency
Line Plots: Frogs in Flight
Have a hopping good time teaching your class how to collect and graph data with this fun activity-based lesson series. Using the provided data taken from a frog jumping contest, children first work together creating a line plot of the...
Curated OER
Box Plots
Young statisticians are introduced to box plots and quartiles. They use an activity and discussion with supplemental exercises to help them explore how data can be graphically represented.
PHET
CME Plotting
Young scientists build on their previous knowledge and apply it to coronal mass ejections. By plotting the path of two different coronal mass ejections, they develop an understanding of why most don't collide with Earth.
National Security Agency
Are You Ready to Call the Guinness Book of Records?
Learners design questions that can be answered by collecting data. In this line-plot lesson, pupils collect data and graph on a line plot on world records. An abundant supply of teacher support is provided in this resource.
Curated OER
Twice Upon a Time: Multi-Cultural Cinderella
Engage your learners in a cross-cultural study by having them read, compare, and contrast various Cinderella stories from different cultures around the world. From this exercise, they will learn that plot element can seem different, but...
Curated OER
Scatter-Brained
Seventh graders graph ordered pairs on a coordinate plane. They create a scatterplot. Additionally, they determine the line of best fit and investigate the slope of the line. Multiple resources are provided. An excellent resource!
Math Mammoth
Stem-and-Leaf Plots 3
In this stem-and-leaf instructional activity, students place statistical data in a stem-and-leaf plot. They identify the median, and range in a given set of data. There are four multi-step problems on this one-page instructional activity.
Curated OER
Baseball Relationships - Using Scatter Plots
Students use graphing calculators to create scatter plots of given baseball data. They also determine percentages and ratios, slope, y-intercepts, etc. all using baseball data and statistics.
Curated OER
Scatter Plots
Seventh graders investigate how to make and set up a scatter plot. In this statistics lesson, 7th graders collect data and plot it. They analyze their data and discuss their results.
Raytheon
Scatter Plots
In this scatter plots worksheet, students complete multiple choice questions about scatter plots having to do with money, free throws, exercising, and more. Students complete 8 problems.
Curated OER
Plotting Data Tables
Students make a table and plot their data on a graph. For this algebra lesson, students graph piecewise functions using the given equations along with the restricted domain. They calculate the rate of change.
Curated OER
Language Practice
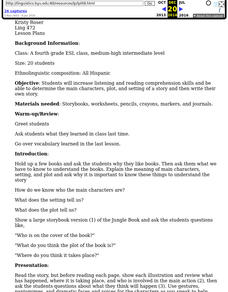
The simple instructional techniques described in this plan will help young readers learn and practice basic reading skills and strategies. Before reading, introduce your readers to the meaning of main character, setting, and plot. Then...
Curated OER
Data Analysis
Young statisticians use and interpret measures of center and spread such as mean, median, and mode as well as range. They use box plots to represent their data and answer questions regarding the correspondence between data sets and the...
PBS
Button, Button
Youngsters count, classify, and estimate quantities using buttons after a read aloud of The Button Box by Margarette S. Reid. They discuss the difference between guessing and estimating. Based on an experiment, they predict the number of...
Curated OER
Story Stew
Young scholars identify the elements of a story. In this reading and writing lesson, pupils read the book, Tyrone the Horrible by Hans Wihelm and then identify the characters, setting, and plot of the story.This lesson includes...
Curated OER
Scatter Plot Basketball
Learners take turns shooting baskets and creating scatterplots based on the data. They create two graphs and look for possible correlation in the data for each graph.
Curated OER
Story Elements that Support the Theme
Three great graphic organizers guide readers to see how the elements of plot and main idea can be charted to reveal the theme of a story. Model the process on the provided Direct Teaching Teacher Graphic Organizer using Aesop’s The...
Curated OER
Which Story Matches the Given Theme?
Model for young learners how to determine the theme of a story. Read aloud Aesop’s The Fox and the Stork. Chart the plot and the main idea of the fable, showing class members how these elements support the theme. Fable titles for guided...
Curated OER
Plot Structure
Ninth graders review the parts of a plot sequence for a short story. They think of a famous Disney movie and plot the events of the movie in the correct plot sequence. They do the same for a comic strip, labeling the exposition, rising...
Curated OER
Plot Summary for Story Elements
Ninth graders identify story elements utilizing a plot summary organizer. In this plot summary lesson, 9th graders discuss the elements of a good story and listen to the story of the three little pigs. Students complete a group plot...
Curated OER
Plot with More Than One Problem
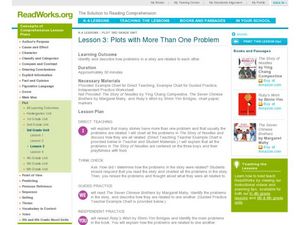
Every good story has a plot, and every good plot contains a conflict or problem. Third graders familiarize themselves and identify how problems in a story are connected. First as a class and then in small groups or individually, learners...
Other popular searches
- Line Plots
- Scatter Plots
- Stem and Leaf Plots
- Box and Whisker Plots
- Box Plots
- Frequency Tables Line Plots
- Scatterplot
- Dot Plots
- Math Scatter Plots
- Line Plots Grade 3
- Stem and Leaf Plots
- Box Whisker Plots


