Curated OER
Logic and Proof Writing
Students define inductive and deductive reasoning and write two column proofs. In this geometry activity, students analyze arguments and draw conclusion. They define steps necessary to arrive at the correct answer when completing proofs.
Curated OER
Graphs
Students explore graphs and define the different ways they are used to display data. In this algebra lesson, students collect data and plot their data using the correct graph. They draw conclusions from their graphs based on their data.
Texas Instruments
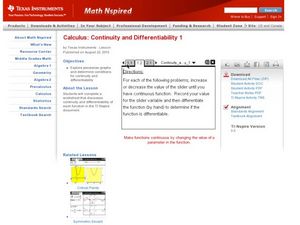
Continuity and Differentiability 1
Pupils examine graphs for continuity and differentiability in this calculus lesson. They observe piecewise functions to see where continuity and differentiability come into play. Learners finish by graphing their equation on the TI...
Curated OER
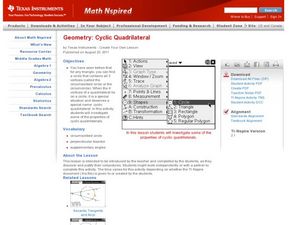
Creating a Cyclic Quadrilateral
Identify and make conjecture about properties of cyclic quadrilaterals. Students use the TI Navigator to create different shapes and draw conclusions.
Curated OER
Cell Phone Range
Here is a 15 minute activity that can be used as review, a warm, or as a quick example of how to relate functions to the real world. Learners complete an application activity and draw conclusion about functions then discuss open and...
Curated OER
Fossil Fuels (Part III), The Geology of Coal
Do not overlook this set of lessons just because your school does not have a data analysis system. There is plenty of material here to administer a complete mini unit on the formation, distribution, and properties of coal. Since it...
Chicago Botanic Garden
Historical Climate Cycles
What better way to make predictions about future weather and climate patterns than with actual climate data from the past? Young climatologists analyze data from 400,000 to 10,000 years ago to determine if climate has changed over time....
Curated OER
Paragraph Lesson
Students write paragraphs with topic sentences and supporting details. In this paragraph writing lesson, students fix sentences and paragraphs. Students also write a paragraph that includes an introduction, supporting details, and a...
Curated OER
Learning Inference
Making inferences can be a tricky proposition for middle schoolers. In the lesson plan presented here, pupils practice the skill of drawing a conclusion and making a judgment - which are what making an inference is all about! There are...
NTTI
Vectors: Traveling, But in What Direction
High schoolers watch a video of real-world situations regarding speed, direction, velocity, force, etc. and answer questions while viewing. They then practice drawing and using vectors to solve more real-world problems.
Syracuse University
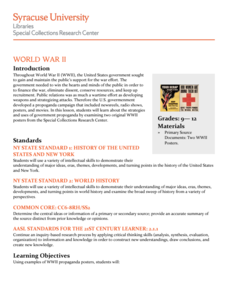
World War II
During World War II propaganda was as important to the war effort as the soldiers in the field. Scholars consider how the government communicated messages of patriotism with propaganda by examining pieces from World War II. Then, they...
Population Connection
Meeting Human Needs
How to meet the needs of people around the globe—a question many ask. The fifth in a six-part series about human population and its effects on the globe, the eye-opening lesson includes discussion, a homework activity, and an in-class...
Curated OER
Pasta Bridges
Students analyze the correct use of technology as it relates to math and science. For this science lesson, students investigate force and weight as it relates to building an object. They build a bridge and draw conclusion based on the...
Curated OER
Graphing Surveys
Students collect data and graph it. In this algebra lesson, students create a survey for their classmates and teachers. They analyze the results from the survey and graph it. They draw conclusion from their data based on the graph.
Curated OER
Related Robots
Students solve problems using implicit differentiation. In this calculus lesson, students take the derivative to calculate the rate of change. They observe two robots and draw conclusion from the data collected on the two robots.
Curated OER
Cartoon Vocabulary
Third and fourth graders complete a vocabulary log which includes a definition, and a sentence that demonstrates the meaning of the word. Then make an illustration that represents the definition of the word. The trick is that they may...
Curated OER
Weather In The World
Students investigate the weather in different places in the world. In this algebra lesson, students use technology to gain an understanding of how to study integers. They add and subtract integers on a number line.
Physics Classroom
As the Crow Flies Lab
A simple, yet memorable, way of practicing with displacement vectors is described here. Divide your class into groups and assign each a different landmark on campus. They measure smaller legs of the path from the classroom to their...
Curated OER
Guided Reading with Elizabeti's Doll
Practice reading strategies using Elizabeti's Doll by Stephanie Stuve-Bodeen. Readers utilize decoding and comprehension strategies before, during, and after reading the story. A detailed list of text features, high frequency words,...
Curated OER
Which Graph is best?
Students use commercial software to organize and visually display data to draw conclusions; students use graphing software to create several types of graphs illustrating the number of each color of M&M's in one bag.
Curated OER
Tune...Um!
Students collect real data on sound. In this algebra lesson, students use a CBL and graphing calculator to observe the graph created by sound waves. They draw conclusion about the frequency of sound from the graph.
Curated OER
Investing
Learners collect data on investments and draw conclusions. In this algebra lesson, students analyze exponential graphs as they relate to money. They discuss the cause of an account balance being high or low.
Curated OER
The Pendulum
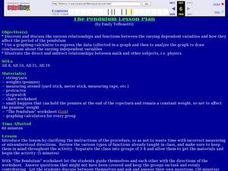
Students discover and discuss relationships and functions between varying dependent variables and how they affect the period of the pendulum. They use graphing calculator to express the data collected in a graph, to analyze the graph,...
Curated OER
Obstacles to Success: Misleading Data
Eleventh graders explore how data reported by country agencies can mislead the public intentionally or unintentionally. In this Cross Curricular activity, 11th graders analyze charts and graphs in order to draw conclusions. Students...


