Math Moves U
Collecting and Working with Data
Add to your collection of math resources with this extensive series of data analysis worksheets. Whether your teaching how to use frequency tables and tally charts to collect and organize data, or introducing young...
Curated OER
Learning to Make Line Graphs
Students analyze data and create a line graph. In this graphing lesson, students explore data from a previous experiment and plot the information on a line graph. Students analyze their findings.
National Security Agency
Line Plots: Frogs in Flight
Have a hopping good time teaching your class how to collect and graph data with this fun activity-based lesson series. Using the provided data taken from a frog jumping contest, children first work together...
Kenan Fellows
Density
Most scholars associate density with floating, but how do scientists determine the exact density of an unknown liquid? The third lesson in a seven-part series challenges scholars to find the mass and volume of two unknown liquids. Each...
Curated OER
What's in a Graph?
Students explore how to use and interpret graphs. The graphs are pulled from a variety of sources, and the activities ask students to interpret graphs. They start this lesson plan with knowledge of what a graph is. Students also know how...
Chicago Botanic Garden
Micro-GEEBITT Climate Activity
A truly hands-on and inquiry based learning activity bridges all the lessons in the series together. Beginning with a discussion on average global temperatures, young meteorologists use real-world data to analyze climate trends in order...
Shodor Education Foundation
Regression
How good is the fit? Using an interactive, classmates create a scatter plot of bivariate data and fit their own lines of best fit. The applet allows pupils to display the regression line along with the correlation coefficient. As a final...
Population Connection
Where Do We Grow from Here?
Did you know that the population is expected to grow to 11 billion by 2100? The resource serves final installment in a six-part series on the global population and its effects. Scholars interpret data from the United Nations about the...
Curated OER
From Playing with Electronics to Data Analysis
Students collect and Analyze data. In this statistics instructional activity, students identify the line of best fit of the graph. They classify lines as having positive, negative and no correlation.
Curated OER
Interpreting Medical Data
Students explore human anatomy by graphing scientific data. In this vision lesson, students discuss how ophthalmology works and take their own eye assessment test using the Snellen chart. Students collect vision data from all of their...
Curated OER
Do These Systems Meet Your Expectations
This lesson is all about systems of equations and their graphs. Algebra learners create and solve systems of equation using tables and graphing. They identify the point of intersection of a system of equation, and discover what the...
University of California
Seasons Lab Book
Unlock the mystery behind seasonal change with a collection of worksheets and activities. Whether they are drawing pictures of Earth's orbit around the sun or graphing the temperature and daylight hours of different locations...
Living Rainforest
Finding the Rainforests
From Brazil to Indonesia, young scientists investigate the geography and climate of the world's tropical rain forests with this collection of worksheets.
CPO Science
Physics Skill and Practice Worksheets
Stop wasting energy searching for physics resources, this comprehensive collection of worksheets has you covered. Starting with introductions to the scientific method, dimensional analysis, and graphing data, these skills practice...
Curated OER
Traveling Through the Solar System
Students use calculator and non-calculator methods for analyzing data. They apply data collection and analysis in a study of mass and weight. Students enhance and apply the concept of line of best fit. They master graphing in a plane,...
Curated OER
Graphs! Graphs! Graphs!
Students practice making charts and graphs from data on spreadsheets. Individually, they create a graph representing the latest information on voter registration. They answer questions and analyze the data to end the lesson.
Curated OER
Data Analysis and Measurement: Ahead, Above the Clouds
Students explore and discuss hurricanes, and examine how meteorologists, weather officers, and NASA researchers use measurement and data analysis to predict severe weather. They plot points on coordinate map, classify hurricanes...
UT Southwestern
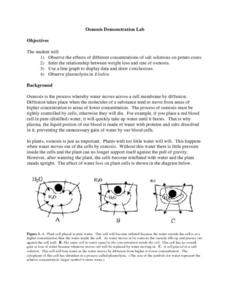
Osmosis Demonstration Lab
Even though they were written for upper-level high schoolers or college pupils, the labs herein are possible to use even in middle school. In the activity, kids observe osmosis in both potatoes and elodea plants, then record and graph...
National Security Agency
Are You Ready to Call the Guinness Book of Records?
Learners design questions that can be answered by collecting data. In this line-plot lesson, pupils collect data and graph on a line plot on world records. An abundant supply of teacher support is provided in this resource.
Curated OER
Scatter-Brained
Seventh graders graph ordered pairs on a coordinate plane. They create a scatterplot. Additionally, they determine the line of best fit and investigate the slope of the line. Multiple resources are provided. An excellent resource!
Curated OER
Weather
Learners create a spreadsheet and chart using data collected. In this weather lesson, students select five cities from their state, including the city they live in. Learners take daily temperature readings from all five...
Curated OER
Show Me!
Students analyze and interpret graphs. In this graphing lesson, students view a video and construct their own graphs (line, circle, bar) from given sets of data.
Curated OER
Line of Best Fit
Students identify the line of best fit. In this statistics activity, students collect and analyze data. They calculate the regression equations and identify the different types of correlation.
WK Kellogg Biological Station
Plotting Phenology
Finally, a activity that involves more than filling in some blanks. Your budding ecologists must graph and analyze three sets of data, then synthesize the information as they think about the impacts of plant reproduction on insects and...


