Worksheet Web
Using Pictographs
If one ice cream cone represents three ice cream scoops, and Bob has four ice cream cones, then how many scoops does Bob have? Learners solve these kind of questions with their new understanding of pictographs.
Math Worksheets 4 Kids
Pictograph Christmas Gifts
Add holiday cheer to math practice with a Christmas themed worksheet designed to reinforce skip counting by two and solving word problems.
Math Worksheets Land
Halloween Interpreting Pictograph
The best part about Halloween is the candy. Individuals read a pictograph that depicts the amount of candy five children received. Then, they respond to five questions using the picture graph to support their answers.
Curated OER
Gummy Bear Picture Graph
First graders investigate picture graphs. In this graphing lesson, 1st graders create a picture graph with the x-axis being number and the y-axis being color. Students sort their gummy bears by color and use pictures of colored bears...
Curated OER
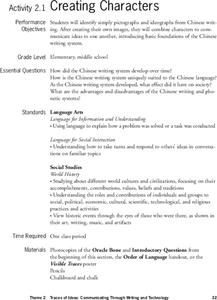
Creating Characters
Students identify simple pictographs and ideographs from Chinese writing. They create their own images, and combine characters to communicate ideas to one another, introducing basic foundations of how elements of the Chinese writing...
Pennsylvania Department of Education
Freckle Face
Students collect and record data. In this early data analysis lesson, students gather data about their partners face. As a class, the students use tally marks and pictographs to record the data and answer question about the information...
Curated OER
Getting There
Young scholars practice reading a pictograph. In this data analysis activity, students collect data and create their own pictograph. A young scholars worksheet is included.
Pennsylvania Department of Education
Months of the Year
Learners develop a pictograph using the months of the year. In this months lesson plan, students place their name with their birth month on a large pictograph. They discuss the information they can see on the graph using the proper names...
Curated OER
Weather Observation Journal
Students record weather for a period of one month. In this weather lesson plan, students observe weather for one month on a large pictograph. Students record clouds, wind, temperature and any other weather conditions they observe....
Curated OER
Connecting With Coordinates
Play a coordinates game to encourage collaborative learning and grid use! Learners plot points on grids and play a game that challenges them to locate a specific point on a coordinate grid by using horizontal and vertical movements.
Curated OER
Can You Count on Cans?
How can a canned food drive be connected to math? It's as simple as counting and organizing the cans! Children demonstrate their ability to sort non-perishable foods into categories that include soup cans, vegetable cans, boxed items,...
Alabama Learning Exchange
Tiger Math Graphing
Learners practice various skills using the book Tiger Math: Learning to Graph from a Baby Tiger. After listening to the story, they create a pictograph using data collected from the text. They also color a picture of a tiger, collect...
National Security Agency
Line Plots: Frogs in Flight
Have a hopping good time teaching your class how to collect and graph data with this fun activity-based lesson series. Using the provided data taken from a frog jumping contest, children first work together creating a line plot of the...
Curated OER
Math: Graphs and Their Symbols
Second graders examine different types of graphs and discover the meanings of the symbols used on them. After gathering data about themselves, their communities, and the world, they use that information to create graphs. Among the...
Curated OER
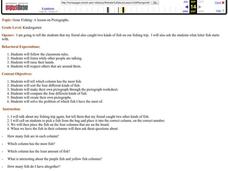
Gone Fishing
Students particapate in a instructional activity on pictographs describing different fish. They observe the columns in the pictographs in order to determine which ones have the most fish and different types of fish. They create their...
Florida Center for Reading Research
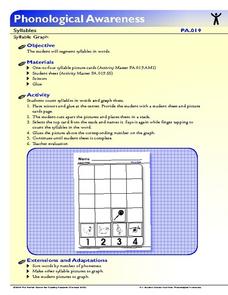
Phonological Awareness: Syllables, Syllable Graph
Scholars make a pictograph based on the number of syllables in each picture card. They choose a card, say the name of the object on the card, break the word into syllables, count the syllables, then glue the picture onto the number chart...
Royal Society of Chemistry
Hazard Symbols
Starting in 2015, all chemicals must have a pictogram of the associated chemical hazards. A brain-building activity reviews four of the basic symbols found in a typical science laboratory. Through a fun puzzle, scholars apply their...
Curated OER
Types of Graphs
Fifth graders construct graphs. In this graphing lesson plan, 5th graders learn about various types of graphs such as bar, line, circle, picture and stem and leaf plot. Students work in groups to create examples of each graph.
Curated OER
Organizing Data Using Tables and Graphs
Students create graphs and tables, as well as interpret and make inferences from the data shown to determine when and where graphs and tables are most useful.
Curated OER
What's Your Favorite Season?
Students collect data on the favorite seasons. In this data collection and analysis lesson, students learn about displaying data on charts and graphs. They collect data about the favorite seasons of the children in their class and...
Mathed Up!
Pictograms
Young mathematicians read, interpret, and complete a variety of real-world pictograms. Each question includes a key and information to complete the graphs.
Curated OER
Graph Club 2.0 Matching
Second graders study graphing using pictographs and bar graphs. They graph pie charts, line graphs, and also change the graph scale up to 1000. They use the pictograph on the left to create the same graph on the right using a bar graph.
Houghton Mifflin Harcourt
Unit 1 Math Vocabulary Cards (Grade 1)
Reinforce mathematical vocabulary with the use of flash cards. Each card showcases a boldly typed word as well as a labeled picture representation of the word. Terms include addition, subtraction, greater than, less than, and more!
Math Moves U
Collecting and Working with Data
Add to your collection of math resources with this extensive series of data analysis worksheets. Whether your teaching how to use frequency tables and tally charts to collect and organize data, or introducing young mathematicians to pie...


