Curated OER
Linear Inequalities in One and Two Variables: Rays and Half Planes
Define rays and half planes, including the concepts of boundary lines and prerequisite knowledge of coordinate planes. Given linear inequalities in one and two variables, your class will compare the differences. They will also graph...
Curated OER
What's My Pattern?
Students recognize, describe and extend patterns in three activities. They organize data, find patterns and describe the rule for the pattern as well as use the graphing calculator to graph the data to make and test predictions. In the...
Curated OER
Introduction to Linear Functions
Students are introduced to the concept of linear functions. Using new terminology, they describe linear functions in sentences and in data tables. Using the internet, they calculate and record answers to problems which are discussed...
Curated OER
Inequalities 7.3
Graph inequalities and discuss the difference in their slopes. Learners observe rate of change as they compare linear, quadratic, and cubic functions.
Curated OER
Functions & Algebra
Students examine linear equations. In this functions and algebra lesson, students write equations in the slope-intercept form. They enter data in a graphing calculator, examine tables, and write linear equations to match the data.
Pennsylvania Department of Education
Multiple Patterns
Students explore patterns that involve doubling numbers. For this multiple patterns lesson, students use objects to explore these patterns while recording them using a table. Students recognize even and odd number patterns while applying...
Curated OER
Move It
Studens collect and graph data. In this algebra lesson, students use a CBL and CBR with a TI Calcualtor to observe linear graphs. They use the correct vocabualry as they discuss the collected data.
Curated OER
That's a Fine Line You're Walking!
Learners experiment with Hiker program to practice real world applications of linear functions and develop their understanding of expressions, relationships, and manipulations involved in writing and graphing linear equations in...
Curated OER
The Window Problem
Students identify patterns and compute formulas to solve the problems. In this algebra instructional activity, students come up with a rule given a pattern, and analyze the relationship between data and graphs.
Curated OER
How Do They Relate? Linear Relationship
Students collect information and use a line to represent it. In this algebra lesson, students investigate real world data to see if it makes a line. They graph the line comparing the relationship of the x axis with that of the...
West Contra Costa Unified School District
The Power of Ten: Building a Magnitude Model
Add visual representation to teaching place value with a magnitude model. Using adding machine tape, pupils build a linear place value strip from 1 to 100.
Curated OER
Know the System
Students identify the different systems of equations. In this algebra lesson, students solve systems of equations using graphing, elimination and substitution. They use the Ti to graph their systems.
Inside Mathematics
Graphs (2006)
When told to describe a line, do your pupils list its color, length, and which side is high or low? Use a worksheet that engages scholars to properly label line graphs. It then requests two applied reasoning answers.
Curated OER
Polly and the Shapeshifter
Students analyze the patterns in polygons and relate it to the rate of change. In this algebra lesson, students discuss the relationship between the data and the graph of the data.
Curated OER
Factoring Trinomials
Students factor trinomials. In this algebra lesson, students identify the different integers making up the trinomial and use the special pattern to factor them. They continue to model the equations and how to factor correctly.
Curated OER
Metric Meals
Sixth graders investigate metric measurements. In this metric measurement lesson, 6th graders explore mass, capacity, and length. Students examine graduated cylinders and balance scales to obtain measurements. Resources are provided.
Curated OER
How Much Will I Spend On Gas?
Students construct a linear graph. In this graphing lesson, students determine a monthly budget for gasoline. Students construct a t-chart and coordinate graph to display data. Resources are provided.
Curated OER
Round and Round and Round We Go!
Pupils investigate motion using a CBL. For this algebra lesson, students collect and graph data on a coordinate plane. They define and identify amplitude and period of conic graphs.
Curated OER
Putting Your Money to Work
Learners create a collect data on expenses. In this algebra lesson, students create a spreadsheet to solve scientific equations. They incorporate math, science and technology in this lesson.
Curated OER
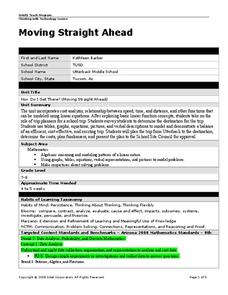
Moving Straight Ahead
Students analyze the relationship between speed, time and distance. In this math lesson, students plan a school trip. Students determine the efficiency and cost effectiveness of a trip.
Curated OER
Math: a World of Symmetry
Students expand their knowledge of quadrilaterals and identify basic symmetrical forms. Over three weeks, they explore the math, application, and discussion of symmetry. After conducting Internet research, students create symmetrical...
Curated OER
Another Way of Factoring
Focusing on this algebra instructional activity, learners relate quadratic equations in factored form to their solutions and their graph from a number of different aspects. In some problems, one starts with the original equation and...
Curated OER
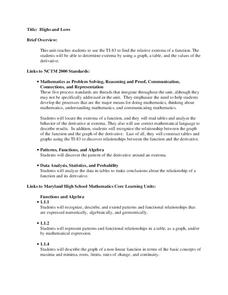
Highs and Lows
Solve problems using integration and derivatives. By using calculus, learners will analyze graphs to find the extrema and change in behavior. They then will identify the end behavior using the derivatives. Activities and handouts are...
Curated OER
Investigating Correlation
High schoolers investigate different types of correlation in this statistics lesson. They identify positive, negative and no correlation as it relates to their data. They then find the line of best fit for the plotted data.


