Curated OER
Walk-A-Thon
Students graph linear http://www.lessonplanet.com/review?id=180542equations. In this problem solving lesson, students calculate slope and plot ordered pairs on a coordinate grid. Using a real-life example of a walk-a-thon, students...
University of Utah
Representations of a Line
Line up to learn about lines! Scholars discover how to express patterns as linear functions. The workbook then covers how to graph and write linear equations in slope-intercept form, as well as how to write equations of...
Curated OER
An Exploration of the Slope of a Line
Learners define the slope of a line. In this algebra lesson plan, students differentiate between parallel and perpendicular lines using their slopes. They rewrite equations in slope intercept form and explain the meaning of the slope.
Curated OER
Lines, Lines, Everywhere
Students explore linear equation suing real life scenarios. In this algebra lesson, students find the slope and intercept of a line. They create table of values to plot their graph and draw conclusions.
Curated OER
Math Mediator Lesson 10: Slope
Pupils explore the concept of slope. In this Algebra I lesson, students investigate the definition of slope as rise over run or change in y compared to change in x. The lesson includes a real-world problem in which the height...
Geometry Accelerated
Coordinate Geometry Additional Practice
Your learners get extra practice using coordinates in calculating mid points, finding end points, deciding if points are collinear, calculations using slope concepts, writing linear equations, using triangles and quadrilaterals, and...
Raytheon
Equations and Graphing Review
In this equations and graphing review instructional activity, learners write, graph and solve equations for 62 problems, including a mid-unit review, with answers included.
American Statistical Association
What Fits?
The bounce of a golf ball changes the result in golf, mini golf—and a great math activity. Scholars graph the height of golf ball bounces before finding a line of best fit. They analyze their own data and the results of others to better...
Curated OER
Slopes and Linear Equations
Young scholars find the slopes of linear functions. In this graphing lesson, students analyze linear equations and calculate the slope of the line. They graph a line given the slope and y-intercept.
Curated OER
Systems of Linear Inequalities in Slope-Intercept Form -- Lecture
Learners are introduced to linear inequalities in slope-intercept form. As a class, they participate when needed in a demonstration given by their teacher and practice graphing inequalities and describing the solution. They set up and...
Mathematics Vision Project
Module 1: Getting Ready Module
This fabulous resource is a must-have for any algebra teacher's arsenal of lessons. Developing the idea of equations and use of variables from basic physical scenarios, learners gain valuable intuition in the structure and meaning of...
Curated OER
Slope and Parallel Lines
Young scholars plot pairs of Cartesian coordinates on graph paper and connect points with straightedges. They examine the lines and determine if they are parallel or not by finding the equations of the lines and comparing the slopes. ...
Curated OER
Identifying Linear Functions from Graphs
Keep your mathematicians engaged using this group linear functions activity. Each of ten groups receives two graphs with both an image and equation, as well as a "who has" phrase to call out the next graph. Scholars stay on their toes as...
Curated OER
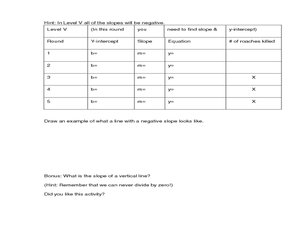
Cockroach Slope
Students identify the slope of linear functions. For this slope lesson, students collect data and graph it. They write equations with no more than two variables and use technology to explain their data.
Curated OER
Graphing Linear Equations Cards
OK, so maybe graphing linear equations can be fun. This activity includes a set of linear equation cards to be cut and place face up on a table. Learners pick a card and match it to the correct graph card. This is a really fun way to...
Curated OER
Finding Slope of a Line
Learners calculate the slope of a line. In this algebra lesson, students graph a line using the slope and y-intercepts. They define the steepness of the line using the slope.
Curated OER
That's a Fine Line You're Walking!
Students experiment with Hiker program to practice real world applications of linear functions and develop their understanding of expressions, relationships, and manipulations involved in writing and graphing linear equations in...
CCSS Math Activities
Smarter Balanced Sample Items: 8th Grade Math – Target C
Target C from the Smarter Balanced assessment for eighth grade is understanding the connections between proportional relationships, lines, and linear equations. A slide show includes items about graphing proportional relationships and...
Curated OER
Baseball Relationships - Using Scatter Plots
Students use graphing calculators to create scatter plots of given baseball data. They also determine percentages and ratios, slope, y-intercepts, etc. all using baseball data and statistics.
Curated OER
Slopes and Lines
Students identify the slopes of a line. In this algebra instructional activity, students calculate the slope and intercept of a line. They graph their lines using a TI calculator.
Curated OER
What's Its Slope
Students identify the slope of a lines.In this algebra lesson, students define the meaning of slope and write an equation given the slope. They graph linear functions using the slope and y-intercept.
Curated OER
Slope and Tangent
Students differentiate between the slope and the tangent of the horizontal. In this precalculus lesson, students examine slopes created by tangent lines. They observe the angle formed using properties of the unit circle.
Curated OER
Am I Straight
Identify the slope of a linear equation in this algebra lesson. Middle schoolers graph linear equations using slopes and intercepts. They identify the slope as being positive, negative, no slope, or undefined.
Curated OER
Two-Variable Linear Inequalities
Here is an engaging instructional activity on solving equations with two variables. Have the class rewrite linear equations in the slope intercept form, y=mx + b. They graph the lines using the slope and y-intercepts.


