CK-12 Foundation
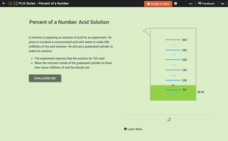
Percent of a Number: Acid Solution
Mathematicians answer five questions about percents, ratios, and proportions with help from an interactive graduated cylinder. Question types include multiple-choice, fill-in-the-blank, and discussion.
Curated OER
Cubed Containers
Learners explore volume in relation to centimeter cubes and other nonstandard units of measurement using small containers. They will use hands-on materials to practice this concept. You will need small objects and containers to set this up.
Curated OER
Down The Line
Learnersinvestigate three-dimensional shapes. In this geometry lesson, pupils calculate the volume of cylinders using the given dimensions. They create a formula base don observation before using the real formula.
Curated OER
Measure Mania
Groups of young scholars rotate through five classroom stations to estimate, measure, and record volume, length, weight, mass, and area using both customary and metric measure. They evaluate their data to determine how close their...
Curated OER
The Metric System
Students practice converting metric measurements by completing the activities listed in this lesson. They first practice measuring common objects. They then convert metric measurements using the included worksheet.
Curated OER
Measuring and Predicting Capacity
Students investigate geometric shapes through volume and dimensions. In this geometry lesson, students measure, weigh, and calculate sizes and volume based on estimation and calculation. They review important vocabulary related to prisms...
Curated OER
Can you Find the Expression
Students collect data from measurements and weights for this experiment. In this algebra lesson, students analyze graphs they create form their data to find the expression representing the data. They label which graph provided the best...


