Yummy Math
Playing with my calculator on the 4th of July
This fun activity guides learners through an exploration of the effects of replacing f(x) with -f(x), f(x) + c, k f(x), and f(x + c). Using graphing calculators, students experiment with variations of the graph of y = x^2 to design a...
College Board
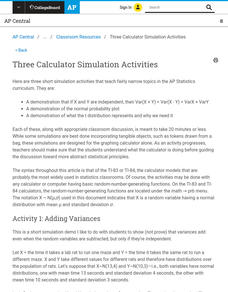
Three Calculator Simulation Activities
Calculators sure come in handy. An AP® Statistics instructional resource provides suggestions for using calculator simulations. It gives activities for adding variances, normal probability plots, and t distributions.
PHET
Graphing Lines
Ready to increase pupils' understanding of slope with an upward slope? Scholars use an interactive that allows users to move two points on a coordinate plane. The interactive then automatically calculates the slope, the slope-intercept...
Curated OER
Voter Turnout
Explore politics by analyzing the voting process. Pupils discuss the purpose of casting votes in an election, then examine graphs based on the data from a previously held election's turnout. The lesson concludes as they answer study...
National Security Agency
What’s Your Coordinate?
Your middle schoolers will show what they know with their bodies when they become the coordinate plane in this conceptual development unit. Starting with the characteristics of the coordinate plane, learners develop their skills by...
Curated OER
Coal Supply and Demand
A hands-on simulation perfect for an economics lesson, young learners investigate the availability of different sources of natural energy (coal, natural gas, oil, solar, and nuclear) and how this availability affects their cost. Simulate...
PHET
Forces in 1 Dimension
A realistic simulation uses charts to show forces, position, velocity, and acceleration versus time based on how the simulation is set up. Once those concepts are mastered, scholars use free body diagrams to explain how each graph...
Laboratory for Atmospheric and Space Physics
Marvelous Martian Mineralogy
Believe it or not ... martian soil does have nutrients needed for plants to survive! An out-of-this-world tutorial moves scholars through an analysis of martian soil to determine its chemical make-up. Pupils analyze reflectivity of...
Curated OER
Lab 2: Drag Racing
In this lesson, students, Analyze the relationship between velocity and acceleration * Calculate an object's average acceleration * Collect data and interpret it* Create and analyze a graph showing acceleration.Students also work in...
Curated OER
Buying Cars/Financing Cars Compound Interest
Provide a real world context in which exponential functions are used to determine a eal world phenomena such as compound interest and exponential growth. This lesson should be taught after students have mastered the laws of exponents and...
Council for Economic Education
Production Possibilities Curve
Demonstrate the important economic principles of the production possibilities curve, including how to calculate opportunity cost and graph curves by using a table or calculation. Learners use a variety of methods, including videos,...
101 Questions
Scrambler
Unscramble a carnival mystery! Scholars observe a video of an overhead view of a carnival ride, The Scrambler. They then must determine mathematically where a specific car will stop after a certain amount of time.
Curated OER
Investigating Velocity Effects at Takeoff
Students use, with increasing confidence, problem-solving approaches to investigate and explain mathematical content. They make and test conjectures. They use tables and graphs as tools to interpret expressions, equations, and inequalities.
Curated OER
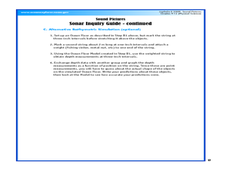
Sound Pictures
Learners examine the components of a sonar system. In this physical science lesson plan students explain how multibeam and sidescan sonar systems are useful to ocean explorers. Learners simulate sonar operations in an activity using a...
Curated OER
Wacky Water World
Eighth graders calculate a system of equations to find the best ticket price for a ticket at a water park. They explain how the equations helped them make their decision on the best price.
Curated OER
Percents: (An Application to Real Life Problems)
Seventh graders explore the concept of calculating percents. In this calculating percents instructional activity, 7th graders simulate ordering food off of a menu. Students work in groups to calculate the bill, tax, and the tip for the...
Curated OER
Fantasy Basketball
Students play Fantasy Basketball in order to practice locating Internet information and using technology tools to display data; students demonstrate an understanding and use of graphing, probability, and statistics.
Curated OER
On the Road Again
Students work with patterns to develop formulas that will help them determine total cost. In this patterning lesson, students watch a video about an NBA trainer. (not included) They work in groups to access the assigned Internet websites...
Curated OER
Design of Airfoil for Given Lift
Pupils use FoilSim to design an airplane wing that generates a given lift. As they change parameters such as airspeed, altitude, angle of attack, thickness and curvature of the airfoil, and size of the wing area, the software calculates...
Curated OER
Using Graphs to Compare
Students use the FoilSim computer simulation program, and demonstrate an understanding of the lift variables by explaining their graphical representations. They demonstrate an understanding of forces and motion.
Curated OER
Simple Machines: The Wede & Lever
Learners describe how wedge and lever makes work easier. For this physics lesson, students analyze experimental data by creating a graph to see the trends. They calculate the work done and mechanical advantage of these simple machines.
Curated OER
Math: Party Time!
Twelfth graders discover how to calculate the total costs for a party. They determine the unit prices of food and supplies, the quantities needed, and complete a chart displaying their findings. Students calculate the costs per serving...
Curated OER
Do You Feel Lucky?
Students calculate simple probabilities using mathematics then roll dice to test their predictions.
Curated OER
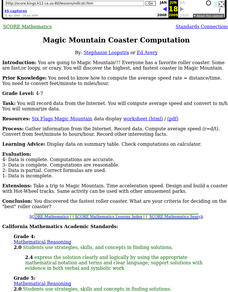
Magic Mountain Coaster Computation
Pupils use the Internet to do research on the roller coasters at Magic Mountain Amusement Park. They must use mathematical formulas to calculate the highest and fastest coaster at the park.
Other popular searches
- Graphing Calculator and Math
- Algebra Graphing Calculators
- Graphing Calculator Math
- Graphing Calculator Skills
- Graphing Calculator Squares
- Graphing Calculator Lessons
- Graphing Calculator Parabola
- Graphing Calculators Ti 83
- Graphing Calculator Activities
- Graphing Calculator Worksheet
- Ti 84 Graphing Calculator


