National WWII Museum
Rationing by the Numbers: Quantitative Data as Evidence
What was it like to live on wartime rations in the United States during World War II? Young historians find out by exploring how those on the home front bought food thanks to the ration system. Other data includes statistics on car sales...
Corbett Maths
Quantitative and Qualitative Data
Classify the Big Ben of all data with a video that defines quantitative and qualitative data. Given data about Big Ben, the presenter classifies each piece based upon the definitions. In the Types of Data learning exercise, individuals...
CK-12 Foundation
Graphs for Discrete and for Continuous Data: Discrete vs. Continuous Data
Not all data is the same. Using the interactive, pupils compare data represented in two different ways. The learners develop an understanding of the difference between discrete and continuous data and the different ways to represent each...
Curated OER
Describing Data
Your learners will practice many ways of describing data using coordinate algebra in this unit written to address many Common Core State Standards. Simple examples of different ways to organize data are shared and then practice problems...
Chicago Botanic Garden
Historical Climate Cycles
What better way to make predictions about future weather and climate patterns than with actual climate data from the past? Young climatologists analyze data from 400,000 to 10,000 years ago to determine if climate has changed over...
American Statistical Association
Happy Birthday to . . . Two?
How many people do you need in a room before two likely share the same birthday? Scholars consider this puzzle by analyzing a set of data. They ponder how to divide the data and determine the proper size of a group for this event to...
American Statistical Association
Bear Hugs
Scholars research arm span to determine who gives the best bear hugs. They use data from a national study to find the standard statistics for arm span. It includes mean, median, quartiles, spread, standard deviation, and more.
American Statistical Association
What Fits?
The bounce of a golf ball changes the result in golf, mini golf—and a great math activity. Scholars graph the height of golf ball bounces before finding a line of best fit. They analyze their own data and the results of others to better...
Curated OER
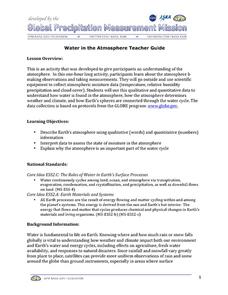
Water in the Atmosphere
A slide show serves as the backdrop for a lesson on the moisture in Earth's atmosphere. Through it, mini meteorologists learn about the attributes of the atmosphere and actually use data-collecting weather tools to make observations and...
Kenan Fellows
Using Water Chemistry as an Indicator of Stream Health
Will this water source support life? Small groups test the chemistry of the water drawn from two different sources. They then compare the collected data to acceptable levels to draw conclusions about the health of the source. The...
Curated OER
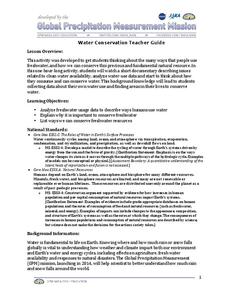
Water Conservation
Open learners' eyes to the challenge of finding safe drinking water – something we often take for granted in our country. The PowerPoint presentation includes images, graphs, diagrams, and even a video to stimulate discussion on how we...
Kenan Fellows
Sensors in Chemistry
The Environmental Protection Agency monitors sensors to track air pollution and set clean air standards. Enthusiastic young scientists use similar sensors to gather data in their area and then apply the gas laws and conservation of...
Kenan Fellows
Qualitative Kinetics: Examining the Effect of an Enzyme on a Reaction
Scholars learn about kinetics and buffers as they use qualitative and quantitative methods to understand enzyme rates and buffer capacity. The application of Beer's Law and spectrophotometry solidifies pupils' knowledge in the first of...
Kenan Fellows
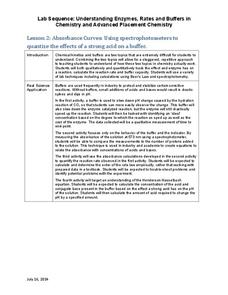
Absorbance Curves: Using Spectrophotometers to Quantize the Effects of a Strong Acid on a Buffer
The Henderson-Hasselbalch equation combined logarithmic terms with the application of carbonic acid as a buffer solution. Scholars learn investigate equation and its applications through hands-on experiments. They collect data and...
Federal Reserve Bank
Monetary and Fiscal Policy in Times of Crisis
Following the 2008 financial crisis in the United States, why did fiscal policymakers increase government spending and reduce taxes? Discover the motivation behind these actions and learn about the separate functions of monetary and...
Kenan Fellows
Reaction Stoichiometry—How Can We Make Chalk?
What is a reasonable percent yield in the manufacturing process? Scholars develop a process for producing chalk in the third lesson of a six-part series. Then, they must determine the theoretical and percent yield. Discussions about...
American Statistical Association
Exploring Geometric Probabilities with Buffon’s Coin Problem
Scholars create and perform experiments attempting to answer Buffon's Coin problem. They discover the relationships between geometry and probability, empirical and theoretical probabilities, and area of a circle and square.
Discovery Education
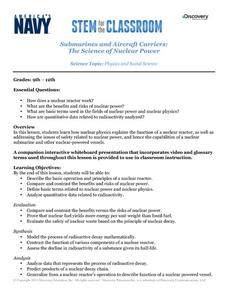
Submarines and Aircraft Carriers: The Science of Nuclear Power
As physics masters view this presentation, they learn how nuclear power is used in submarines. They use Google Maps to plot a course through the ocean and calculate the time required for surfacing and traveling. They learn about fission,...
Curated OER
Water in the Geosphere
Through a PowerPoint presentation and the embedded animation and video, earth science enthusiasts find out about the moisture in the soil beneath our feet. In the animation, follow a water molecule on its path through the water cycle. As...
Personal Genetics Education Project
Personalized Medicine
Genetics learners read an article and watch a video about personalized medicine and the hope it holds for treating patients more specifically than doctors currently are able to. They research, design, and produce a brochure about the...
Personal Genetics Education Project
Genetics and Reproduction
Disease prevention or designer babies? Use a set of slides to introduce the growing practice of preimplantation genetic diagnosis, or PGD. Teens read related articles and then break into groups to address different scenarios. Afterward,...
We are Teachers
What Goes Up Must Come Down
From understanding stock market performance and return on investment to identifying the costs and benefits of credit and avoiding debt problems, this is an absolute must-have resource for financial planning and literacy.
Curated OER
Water in Earth's Hydrosphere
Environmentalists test stream water for temperature, pH, and turbidity. Each group shares their information and then the class makes an overall evaluation of the water quality. A slide show sets the backdrop for the teaching portion and...
Personal Genetics Education Project
Protecting Athletes with Genetic Conditions: Sickle Cell Trait
Should school and professional teams test athletes for sickle cell trait? Will it protect them by providing knowledge or lead to discrimination by not allowing them to participate in sports? After learning about this genetic disorder,...


