Do2Learn
T-Chart (Basic)
T-charts make a great note taking tool. Here's a template for a basic one appropriate for all learners and all subject areas.
San Jose Unified School District
Multiplication Chart
Looking to support your young mathematicians with mastering their multiplication facts? Then this set of multiplication charts is a great place to start, allowing children to visualize the the relationships between factors and multiples.
Santa Barbara City College
How to Make a Multiplication Table
Teach children how to make a multiplication table, and they'll be multiplying for life. Following this series of steps, young mathematicians learn to use patterns and the relationships between numbers to create...
World Wildlife Fund
Land of the Midnight Sun
From days of 24 hour sunlight, to endless nights that last for days, the Arctic is a very unique place to live. Examine the seasonal changes that occur in the northern-most reaches of the globe and the impact they have on the plants and...
Do2Learn
T-Chart (Topics of Conversation)
A T-chart matrix provides learners with a way to record the different responses to a conversation.
iCivics
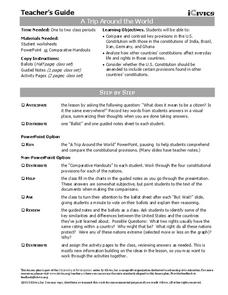
A Trip Around the World
How do the rights of citizens in other countries, such as India, Germany, Brazil, and Iran, compare to those of Americans? Take a closer look at the provisions of various foreign constitutions, and compare and contrast the protections...
ARKive
Handling Data: African Animal Maths
Handling and processing data is a big part of what real scientists do. Provide a way for your learners to explore graphs and data related to the animals that live on the African savannah. They begin their analysis by discussing what they...
Curated OER
Corporate Tax Rate and Jobs
Does lowering the corporate tax rate help create jobs in the United States? Learners explore the top pro and con arguments and quotes relating to the issue. They read background information about the creation of the federal corporate...
PBS
Measuring Waves | UNC-TV Science
Discover the secrets used by scientists to measure mechanical waves. Young physicists learn about measurable wave qualities—amplitude, wavelength, and frequency—by watching and listening to a video discussing longitudinal and transverse...
Music Fun
Recorder Fingering Worksheets
High notes and low notes. Sharps and flats. Recorder players perfect their fingering with a series of music worksheets that ask them to practice identifying correct fingering patterns and connecting these patterns to the...
Weebly
Team Building Activities
Need some ideas for team-building activities? This 27-page packet contains a wide variety suggestions, everything from back-to-school bingo to positive comments name charts. There's even an inspirational poem by David Roth...
Mathematics Vision Project
Module 2: Systems of Equations and Inequalities
The brother-sister pair Carlos and Clarita need your class's help in developing their new pet sitting business. Through a variety of scenarios and concerns presented to the siblings, the learners thoroughly explore systems of equations...
Miami-Dade County Public Schools
Veteran's Day—Honoring All That Served
Looking for ideas on ways to recognize Veteran's Day? Check out this 92-page packet that includes exercises designed for all grade levels. Reading passages detail the history of the holiday, research projects get individuals involved in...
West Contra Costa Unified School District
Quadratic Equations — What We Know
Everything you could possibly want to know about quadratic equations, all in one resource. Instructors demonstrate how to translate between different forms of quadratics (equation, table of values, graph, verbal description) and finding...
Media Smarts
The Broadcast Project
As part of a unit on media studies, kids are asked to chart their viewing habits, observe the advertising that sponsors their favorite shows, and then to imagine what they would broadcast if given a block of airtime.
Charleston School District
Graphing Functions
How do letters and numbers create a picture? Scholars learn to create input/output tables to graph functions. They graph both linear and nonlinear functions by creating tables and plotting points.
Math12
Basics of Probability
Give your middle schoolers a fighting chance at understanding probability. Offering numerous examples that clearly demonstrate basic probability concepts, this resource helps young mathematicians learn how to visualize the...
Positively Autism
My Family's Thanksgiving
Prepare for the excitement of Thanksgiving with a helpful slideshow presentation. Colorful and engaging, the presentation explores Thanksgiving symbols, details, and traditions, and prompts learners to contrast the given topics with...
Ed Worksheets
Read the Story
Want to boost your readers' comprehension skills and strategies? Look to these five pages, each with a short story and questions to answer covering main idea, facts, sequence of events, context clues, conclusions, and making...
Candace Fleming
Ben Franklin’s Almanac: Being a True Account of the Good Gentleman’s Life
Candace Fleming's award winning Ben Franklin's Almanac is the anchor text for a classroom guide that provides teachers with a cache of pre, during, and post-reading activities.


