EngageNY
Some Facts About Graphs of Linear Equations in Two Variables
Develop another way to find the equation of a line. The lesson introduces the procedure to find the equation of a line given two points on the line. Pupils determine the two points from the graph of the line.
EngageNY
The Line Joining Two Distinct Points of the Graph y=mx+b Has Slope m
Investigate the relationship between the slope-intercept form and the slope of the graph. The lesson plan leads an investigation of the slope-intercept equation of a line and its slope. Pupils realize the slope is the same as the...
NASA
Geographical Influences
"If global warming is real, why is it so cold?" Distinguishing the difference between weather and climate is important when it comes to understanding our planet. In these activities, young scientists look at the climate patterns in a...
Annenberg Foundation
Skeeters Are Overrunning the World
Skeeters are used to model linear and exponential population growth in a wonderfully organized lesson plan including teachers' and students' notes, an assignment, graphs, tables, and equations. Filled with constant deep-reaching...
BW Walch
Solving Linear Inequalities in Two Variables
Although graphing a linear inequality on the plane is but a few steps added onto the graphing of a linear equation, for many learners the logical leap is quite intimidating. This approachable PowerPoint presentation breaks graphing...
BW Walch
Solving Systems of Linear Equations
Solving systems of equations underpins much of advanced algebra, especially linear algebra. Developing an intuition for the kinds and descriptions of solutions is key for success in those later courses. This intuition is exactly what...
Wordpress
I Can Find Slope
Your young mathematicians will appreciate this wonderfully organized summary and explanation of linear slope. Approaching slope as it looks in a table of values, on a graph, in an equation, and between two points, this note sheet is...
West Contra Costa Unified School District
Graphing Systems
Get hands on with solving systems of equations graphically. A solid lesson plan uses guided practice to show how to solve systems of linear equations. It allows time for sharing ideas and provides a printable matching activity to promote...
Berkshire Museum
Camouflage!: Collecting Data and Concealing Color
Help young scholars see the important role camouflage plays in the survival of animals with a fun science lesson. Starting with an outdoor activity, children take on the role of hungry birds as they search for worms represented by...
CK-12 Foundation
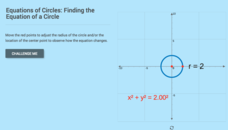
Equations of Circles: Finding the Equation of a Circle
It's all about location and size. With the aid of the interactive, pupils explore the relationship between the location and size of a circle and its equation. The learners use that relationship to determine the equation of a circle given...
Wordpress
Introduction to Exponential Functions
This lesson begins with a review of linear functions and segues nicely over its fifteen examples and problems into a deep study of exponential functions. Linear and exponential growth are compared in an investment task. Data tables are...
EngageNY
Graphs of Linear Functions and Rate of Change
Discover an important property of linear functions. Learners use the slope formula to calculate the rates of change of linear functions. They find that linear functions have constant rates of change and use this property to determine if...
Illustrative Mathematics
Find the Change
This exercise is an opportunity for algebra learners to understand the connection between the slope of a line and points found on the line. Use similar triangles to explain why slope m is the same between any two points. Discuss with the...
EngageNY
The Slope of a Non-Vertical Line
This lesson introduces the idea of slope and defines it as a numerical measurement of the steepness of a line. Pupils then use the definition to compare lines, find positive and negative slopes, and notice their definition holds for...
Benjamin Franklin High School
Saxon Math: Algebra 2 (Section 3)
In this third of a twelve-part series, the focus moves from using matrices to solving systems of equations with substitution and elimination, including more than two dimensions and variables in equations, and analyzing statistical data....
EngageNY
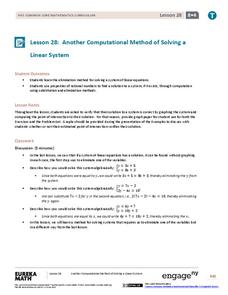
Another Computational Model of Solving a Linear System
The process of elimination really works! Use elimination when substitution isn't doing the job. The 29th segment in a series of 33 introduces the elimination method to solving linear systems. Pupils work several exercises to grasp the...
West Contra Costa Unified School District
Quadratic Equations — What We Know
Everything you could possibly want to know about quadratic equations, all in one resource. Instructors demonstrate how to translate between different forms of quadratics (equation, table of values, graph, verbal description) and finding...
Exploratorium
Traveling Networks
Show your class the path to understanding graph theory. Scholars learn about basic graph theory using an activity based on the Bridges of Konigberg problem. They draw networks on the playground and decide whether it is possible to travel...
CK-12 Foundation
Limit of a Sequence: Finding the Limit of a Sequence (Part 1)
Put a squeeze on a sequence. An interactive provides a graphical display of a sequence. Using the graph, learners determine the algebraic expression for the sequence. Pupils use the general definition of a limit of a sequence to find the...
Museum of Tolerance
Why is This True?
Are wages based on race? On gender? Class members research wages for workers according to race and gender, create graphs and charts of their data, and compute differences by percentages. They then share their findings with adults and...
K20 LEARN
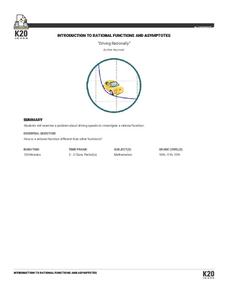
Driving Rationally: Introduction To Rational Functions And Asymptotes
Calculating average speeds is not as simple as finding an average. The lesson introduces class members to rational functions by presenting a problem about finding an average speed for the rest of a trip. Pupils develop an equation to...
American Statistical Association
What Fits?
The bounce of a golf ball changes the result in golf, mini golf—and a great math activity. Scholars graph the height of golf ball bounces before finding a line of best fit. They analyze their own data and the results of others to better...
Flipped Math
Intro to Quadratics
Quadratics need no introduction, but here is one anyway. Learners watch a video that introduces them to quadratics. The pupils learn what a quadratic is, its key features, and how to sketch a graph of the parabola it defines. Then, they...
Flipped Math
Sketching Polynomial Functions
Provide a sketch of the suspect. Scholars see how to use the key aspects they know about polynomials to create a sketch of the graph. Learners factor to calculate the zeros by factoring, find the end behavior, and determine the...


