EngageNY
Drawing the Coordinate Plane and Points on the Plane
To plot a point in the coordinate plane, you first need a coordinate plane. Pupils learn to draw an appropriate set of axes with labels on a coordinate plane. They must also determine a reasonable scale to plot given coordinate pairs on...
CK-12 Foundation
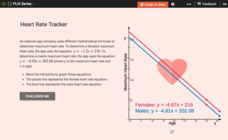
Graphs of Linear Systems: Heart Rate Tracker
Max out heart rates for males and females. Formulas of maximum heart rates provide the equations for a linear system. Pupils use the interactive to graph the equations for males and females and determine their points of intersection. The...
Mathed Up!
Transformation of Graphs
In what ways can you transform a graph? An engaging video answers this question as it covers reflections, translations, and stretches of graphs. To test their knowledge, individuals complete a set of problems to apply this knowledge.
EngageNY
Representations of a Line
Explore how to graph lines from different pieces of information. Scholars learn to graph linear functions when given an equation, given two points that satisfy the function, and when given the initial value and rate of change. They solve...
EngageNY
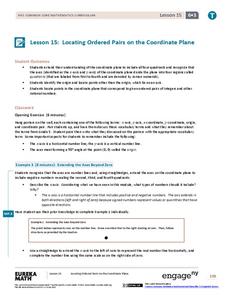
Locating Ordered Pairs on the Coordinate Plane
Four quadrants, four times the fun. Future mathematicians learn the terminology associated with the coordinate plane and how to plot points in all four quadrants. A worksheet tests their understanding of the material in the 16th...
EngageNY
Introduction to Simultaneous Equations
Create an understanding of solving problems that require more than one equation. The lesson introduces the concept of systems of linear equations by using a familiar situation of constant rate problems. Pupils compare the graphs of...
National Council of Teachers of Mathematics
Stitching Quilts into Coordinate Geometry
Who knew quilting would be so mathematical? Introduce linear equations and graphing while working with the lines of pre-designed quilts. Use the parts of the design to calculate the slope of the linear segments. The project...
Mathed Up!
Inequalities Regions
Discover how to solve systems of inequalities by graphing. An informative video shows pupils how to determine the solution set after graphing each inequality of a system. To finish, a worksheet gives them a chance to practice this skill.
EngageNY
Modeling Linear Relationships
Math modeling is made easy with the first installment of a 16-part module that teaches pupils to model real-world situations as linear relationships. They create graphs, tables of values, and equations given verbal descriptions.
Mathed Up!
Cumulative Frequency and Box Plots
Learn how to display data. Young data analysts watch a video to review how to create cumulative frequency histograms and box plots. They work on a set of questions to practice producing these data displays.
EngageNY
Multi-Step Problems in the Real World
Connect graphs, equations, and tables for real-world problems. Young mathematicians analyze relationships to identify independent and dependent variables. These identifications help create tables and graphs for each situation.
Mathed Up!
Histograms
Class members explore how to read and use histograms by watching a video on creating and analyzing histograms. To finish, the class works on a set of questions that tests these skills.
College Board
AP Calculus: Slope Fields
Ready to field questions about slope fields? An article on AP® Calculus teaching methods describes how to teach about slope fields to solve differential equations. It gives some sample problems to consider with the class and how to...
EngageNY
Problem Solving and the Coordinate Plane
Class members investigate rectangles on the coordinate plane. They determine the length of line segments in the coordinate plane with the same x-coordinate or same y-coordinate and then solve geometric problems involving perimeter...

