Embedded Math
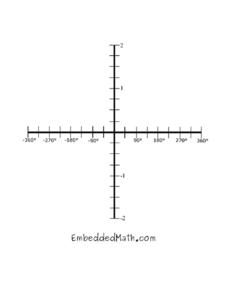
Trig Graph
You and your learners will enjoy having many copies of this trigonometric graph set on the Cartesian coordinate grid with a domain running from -360 degrees to 360 degrees and a range running from -2 to 2.
Granite School District
7th Grade CCSS Math Vocabulary Word List
Address key vocabulary in the seventh grade Common Core Math Standards with this comprehensive list. A series of word cards is also provided that supports each term with images and examples, making this an excellent tool for teaching the...
Corbett Maths
Coordinates and Shapes
Where is the point? Given three points on the coordinate plane, the video walks through the steps to find the location of the fourth point to create a given special quadrilateral. The narrator first determines the coordinates of the...
EngageNY
Identifying Proportional and Non-Proportional Relationships in Graphs
Graph a relationship to find out if it is proportional. The instructional activity introduces the criteria for determining whether a relationship is a proportional relationship based on its graph. Pupils graph relationships and determine...
BW Walch
Creating and Graphing Linear Equations in Two Variables
This detailed presentation starts with a review of using key components to graph a line. It then quickly moves into new territory of taking these important parts and teasing them out of a word problem. Special care is...
West Contra Costa Unified School District
Graphing Exponential Functions
Once you know how to graph y = b^x, the sky's the limit. Young mathematicians learn to graph basic exponential functions and identify key features, and then graph functions of the form f(x) = ab^(x – h) + k from the function f(x) = b^x.
National Council of Teachers of Mathematics
Stitching Quilts into Coordinate Geometry
Who knew quilting would be so mathematical? Introduce linear equations and graphing while working with the lines of pre-designed quilts. Use the parts of the design to calculate the slope of the linear segments. The project...
EngageNY
Drawing the Coordinate Plane and Points on the Plane
To plot a point in the coordinate plane, you first need a coordinate plane. Pupils learn to draw an appropriate set of axes with labels on a coordinate plane. They must also determine a reasonable scale to plot given coordinate pairs on...
EngageNY
Problem Solving and the Coordinate Plane
Class members investigate rectangles on the coordinate plane. They determine the length of line segments in the coordinate plane with the same x-coordinate or same y-coordinate and then solve geometric problems involving perimeter...
EngageNY
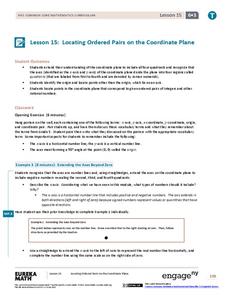
Locating Ordered Pairs on the Coordinate Plane
Four quadrants, four times the fun. Future mathematicians learn the terminology associated with the coordinate plane and how to plot points in all four quadrants. A worksheet tests their understanding of the material in the 16th...
Charleston School District
Graphing Functions
How do letters and numbers create a picture? Scholars learn to create input/output tables to graph functions. They graph both linear and nonlinear functions by creating tables and plotting points.
EngageNY
Every Line is a Graph of a Linear Equation
Challenge the class to determine the equation of a line. The 21st part in a 33-part series begins with a proof that every line is a graph of a linear equation. Pupils use that information to find the slope-intercept form of the...
EngageNY
Graphs of Simple Nonlinear Functions
Time to move on to nonlinear functions. Scholars create input/output tables and use these to graph simple nonlinear functions. They calculate rates of change to distinguish between linear and nonlinear functions.
EngageNY
Interpreting Graphs of Proportional Relationships
What do those points on the graph mean? The 10th instructional activity in a series of 22 presents proportional relationships as graphs. Class members interpret various points of the graph — including the origin — within the context of...
West Contra Costa Unified School District
Graphing Piecewise Functions
Step up to learn about step functions. The lesson plan, designed for high schoolers, first covers piecewise functions and how to draw their graphs. It then introduces step functions, including the greatest integer (floor) and...
CK-12 Foundation
Polygon Classification in the Coordinate Plane
Classify this resource into the "Use" pile. Scholars use an interactive coordinate plane to plot polygons given coordinates for the vertices. They use properties to classify each polygon and answer a few challenge questions regarding the...
EngageNY
Graphing Rational Functions
Put everything together in a picture. Scholars take what they learned in the previous three lessons in the 15th segment of a 23-part unit to graph rational functions. They find the end behavior, the horizontal and vertical asymptotes if...
Virginia Department of Education
Circles in the Coordinate Plane
Make the connection between the distance formula and the equation of a circle. The teacher presents a lesson on how to use the distance formula to derive the equation of the circle. Pupils transform circles on the coordinate plane and...
EngageNY
Dilations on the Coordinate Plane
Dilations from the origin have a multiplicative effect on the coordinates of a point. Pupils use the method of finding the image of a point on a ray after a dilation to find a short cut. Classmates determine the short cut of being...
EngageNY
Some Facts About Graphs of Linear Equations in Two Variables
Develop another way to find the equation of a line. The lesson introduces the procedure to find the equation of a line given two points on the line. Pupils determine the two points from the graph of the line.
Virginia Department of Education
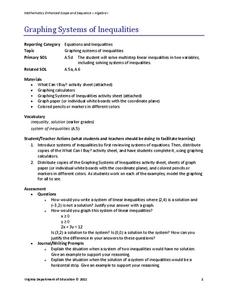
Graphing Systems of Inequalities
Apply systems of inequalities to a real-world problem. Here, scholars learn to graph solutions to systems of linear inequalities. To finish the lesson, they solve a problem involving burgers and cheeseburgers using a system of inequalities.
EngageNY
The Line Joining Two Distinct Points of the Graph y=mx+b Has Slope m
Investigate the relationship between the slope-intercept form and the slope of the graph. The lesson plan leads an investigation of the slope-intercept equation of a line and its slope. Pupils realize the slope is the same as the...
Corbett Maths
Transformations of Graphs
Geometric transformations in algebra ... what? Given four transformations, the narrator explains how each affect the graph of the original function. The transformations involve translations and reflections, both horizontally and...
CK-12 Foundation
Evaluate Limits Using Graphs and Tables: Where Is That Limit?
Limits are made easy through graphs and tables. An easy-to-use interactive lets users change a function on a coordinate plane. They relate graphs and tables to the limit at a specific value.


