Math Worksheets Land
Find Percentages of Numbers - Step-by-Step Lesson
Finding a percentage of a number is a skill learners must know in order to be successful thinkers. The resource introduces this concept with a guided explanation and can be used with the additional materials as a...
Mathed Up!
Percentages
Review a percentage of math skills. Designed to review for the General Certificate of Secondary Education Math assessment, the resource provides practice with a variety of percent problems. Items provide pupils problems ranging from...
Illustrative Mathematics
Discounted Books
Adolescents love to shop, especially when an item is discounted. Here, shoppers only have a set amount of money to spend. Will they be able to make a purchase with the discount and tax added in? Percent discounts can be calculated...
Polar Trec
Where is the World's Water?
Scholars discover the amount of the Earth's water in various locations such as the ocean, ice, the atmosphere, etc. They then make a model of the how much water those percentages represent. Finally, analysis questions bring the concepts...
CK-12 Foundation
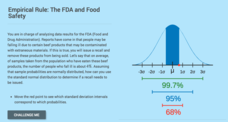
Computing Probabilities for the Standard Normal Distribution: The FDA and Food Safety
To recall or not to recall, that is the question. Using provided data, pupils calculate the percent of people that may fall ill on average. The scholars determine the standard deviation based upon the mean and the empirical rule,...
CK-12 Foundation
Overview of Percents: Play Checkers
Bet classes didn't know playing checkers help with understanding percents. An interesting interactive has pupils consider a series of moves in checkers. It then requires them to answer a set of challenge questions on percentages...
Math Worksheets Land
Patterns of Association (Using Data Tables) - Guided Lesson
The worksheet belongs to a four-part resource that applies percentages to data tables. The page has three practice problems that continues with the development of this topic.
Museum of Tolerance
Why is This True?
Are wages based on race? On gender? Class members research wages for workers according to race and gender, create graphs and charts of their data, and compute differences by percentages. They then share their findings with adults and...
National Research Center for Career and Technical Education
Hospitality and Tourism 2: Costing
The lesson plan provides a richly detailed narrative and sample problems for teaching or reinforcing how to work with percentages. In particular, your audience will compute the costs per serving of food and simulate setting menu prices...
Education World
The African American Population in US History
How has the African American population changed over the years? Learners use charts, statistical data, and maps to see how populations in African American communities have changed since the 1860s. Activity modifications are included to...
National Research Center for Career and Technical Education
Business Management and Administration: Compound Interest - A Millionaire's Best Friend
Many math concepts are covered through this resource: percentages, decimals, ratios, exponential functions, graphing, rounding, order of operations, estimation, and solving equations. Colorful worksheets and a link to a Google search for...
Curated OER
Numbers in Spanish
Spanish learners can start with uno, dos, y tres and move all the way up into the millions and trillions on their way to learning all the numbers. The webpage includes information on cardinal numbers, ordinal numbers, fractions, and...
Willow Tree
Weighted Averages
Mixtures, weighted percentages, and varying speeds make problem solving difficult. The resource give learners a strategy for tackling these types of problems effectively.
Beyond Benign
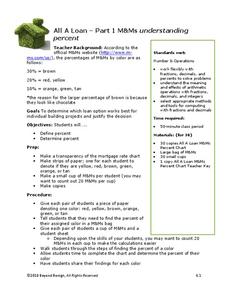
All A Loan
When designing a house, it's important to know about percents. Through a series of three lessons, scholars first review percentages through an activity involving M&Ms and then apply that knowledge to calculate compound interest and...
EngageNY
Writing, Evaluating, and Finding Equivalent Expressions with Rational Numbers 2
The 20th segment in a series of 25 has learners work with percentage problems to generate equivalent expressions. Pupils find discounted prices using numerical and algebraic expressions. The task then requires individuals to find the...
CK-12 Foundation
Complement Rule for Probability: Changes in an Election
Pupils determine the probability of one mayoral candidate winning given the other's chance. The interactive provides a circle graph to help visualize each candidate's percentages of winning.
CK-12 Foundation
Additive and Multiplicative Rules for Probability: Red Dress? Blue Dress? Both!
The sum of the parts is greater than the whole. An interactive uses a Venn-like model to show the percentage of females from a survey that have a blue dress, a red dress, or both. The pupils determine the numbers in each category...
US Department of Commerce
Diversity: Differences in Communities
Using census data, the class finds the percentages of three diversity categories for four states and compare them. With the assistance of a 10 X 10 grid, pupils create visual representations of a comparison between two states on one...
US Department of Commerce
Exploring Sampling Variability - Higher Education Attainment Across The United States
More education in statistics is always beneficial. Given cards that provide the proportion of adults with bachelor's degrees in 10 random US states, scholars individually determine the sample percentage of states in which more than 30...
US Department of Commerce
Educational Attainment and Marriage Age - Testing a Correlation Coefficient's Significance
Do women with college degrees get married later? Using a provided scatter plot of the percentage of women who earn bachelor's degrees and the median age at which women first get married over time, pupils conduct a linear regression...
US Department of Commerce
Over the Hill - Aging on a Normal Curve
Nobody is too old to learn something new. Young statisticians analyze census data on the percentage of the population older than 65 years old in US counties. They fit a normal distribution to the data, determine the mean and standard...
US Department of Commerce
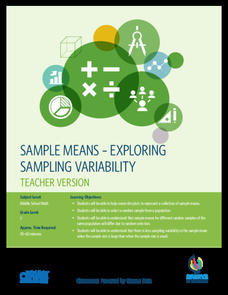
Sample Means - Exploring Sampling Variability
Sample an excellent resource on sampling variability. Pupils analyze census data on the percentage of homes in each state that have Internet access. They take random samples of different sample sizes, determine the sample means, and then...
Math Worksheets Land
Patterns of Association (Using Data Tables) - Independent Practice Worksheet
Here is a worksheet that belongs in a four-part resource that has learners practice using data tables to calculate percentages. The page has ten problems with different data tables asking to find different...
Global Oneness Project
Citizen Photojournalism
Matt Black's photo essay, "The Geography of Poverty" provides a shocking reminder of the poverty that exists in the United States. The resource not only focuses attention on poverty but also conditions that have given rise to situation...
Other popular searches
- Teaching Percentages
- Figuring Percentages
- Calculating Percentages
- Basic Money Percentages
- Math Percentages
- Markup Percentages
- Discount Percentages
- Decimals and Percentages
- Percentages and Math
- Math Lessons on Percentages
- Circle Percentages
- Percentages of Quantities


