Earth Watch Institute
Entering Local Groundhog Data in an Excel Spreadsheet
Here is a cross-curricular ecology and technology lesson; your learners create spreadsheets depicting the location and number of groundhog dens in a local park. They research groundhogs and analyze data about where the groundhog...
Concord Consortium
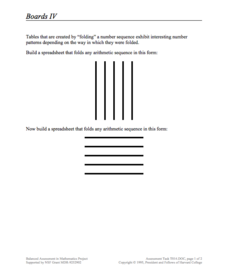
Boards IV
Build a connection between algebraic sequences and spreadsheets. Learners examine a specific folding pattern and convert the pattern into a spreadsheet. The goal of the spreadsheet is to produce a sequence of a specific pattern modeled...
CK-12 Foundation
Compound Interest per Period: Credit Card Payment
Credit cards can be convenient, but are they worth it? Future consumers learn about compound interest and credit card payments. They use an interactive to create a table that shows the remaining balance after each month.
Open Oregon Educational Resources
Beginning Excel
How can Microsoft Excel help manage data in people's personal and professional lives? Using the Beginning Excel eBook, scholars learn the basics of creating, editing, and using spreadsheets. They explore spreadsheet design, formulas,...
Howard Hughes Medical Institute
Spreadsheet Tutorial 5: Histogram
A professional-looking histogram is just a few clicks away. The last installment of a five-part Spreadsheet Data Analysis series focuses on histograms. Learners work through a tutorial to see how spreadsheets can help make frequency...
American Institutes for Research
Digital Smiles
Explore metric measurement, recording data, and creating an electronic spreadsheet displaying results with your math class. Scholars will measure the length of their smiles, record the measurements, and represent the results on an...
Howard Hughes Medical Institute
Spreadsheet Tutorial 2: Autofill Data, Cell References, and Standard Deviation
If you've always wanted to know more about spreadsheets, here's a perfect resource for you. A self-paced tutorial introduces how to autofill and copy formulas in a Google sheet or Excel spreadsheet. It also shows users how to find range,...
Texas Education Agency (TEA)
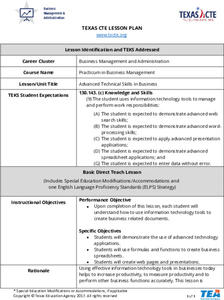
Advanced Technical Skills in Business
Scholars put their technical skills to the test as they practice writing a business letter, creating charts and spreadsheets, and designing a flyer. Additionally, pupils create a PowerPoint presentation about a professional topic of...
Howard Hughes Medical Institute
Spreadsheet Tutorial 3: Column Graphs, Error Bars, and Standard Error of the Mean
There's absolutely no error in using the tutorial! Learners use spreadsheets to create column or bar graphs with error bars. They also learn how to calculate the standard error of the mean in the tutorial. This is the third installment...
EngageNY
Normal Distributions (part 2)
From z-scores to probability. Learners put together the concepts from the previous lessons to determine the probability of a given range of outcomes. They make predictions and interpret them in the context of the problem.
REMC Association of Michigan
Remc Association of Michigan: 21 Things4 Students: 13. Dig the Data
This tutorial contains ten quests. You will learn to create spreadsheets and charts, use formulas, and make decisions based on data. The first five quests has students plan a party and in the last five, they collect and analyze data for...
Department of Defense
Do Dea: M1: L4: Starting Here, Starting Now! Beginning a Spreadsheet
In Module 1 Lesson 4 of this course on spreadsheets, students create their first spreadsheet using Microsoft Excel. Includes slideshow tutorials.
Goodwill
Gcf Global: Google Drive
In this tutorial, learn how to use this cloud-based program to create and share documents, spreadsheets, presentations, and more.


