Hi, what do you want to do?
Curated OER
Changing Planet: Rising Ocean Temperatures - Rising Sea Levels
As an anticipatory set, young environmental technicians watch a video about how ocean temperatures seem to be changing along with the global climate. They perform a laboratory demonstration with the purpose of observing what happens to...
Curated OER
Ocean Circulation
In this physical oceanography PowerPoint, viewers learn about ocean circulation, sea surface temperatures, and salinity. Relationships among these aspects are explained, as well as their impact on the atmosphere and climate. Each slide...
Curated OER
Temperature of the Pacific Ocean
Young scientists demonstrate how the Earth's temperature has varied gradually in the past. They attempt to answer four questions which all pertain to how the Pacific Ocean's temperature has evolved over time. Internet research, and a...
Curated OER
When Floating Ice Melts in the Sea
With this simple inquiry exercise young scientists observe the effects of melting ice on water level. Set up an easy experiment with floating ice cubes in a dish of water then have your pupils make and record their observations of the...
Curated OER
Hurricane Frequency and Intensity
Students examine hurricanes. In this web-based meteorology lesson, students study the relationship between ocean temperature and hurricane intensity. They differentiate between intensity and frequency of hurricanes.
Georgia Department of Education
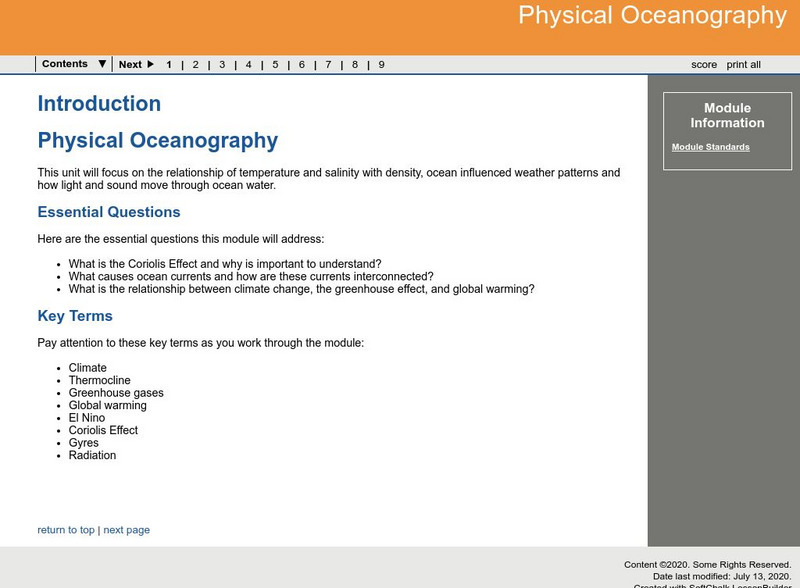
Ga Virtual Learning: Physical Oceanography
A student learning module with a focus on the relationship of temperature and salinity with density, ocean-influenced weather patterns, and how light and sound move through ocean water.
Science Buddies
Science Buddies: Do Warmer Seas Make Stronger Hurricanes?
We've all heard that hurricanes draw their immense power from warm ocean waters. Of course, many factors contribute to the formation and growth of a hurricane, but can we expect to find that the warmer the water, the stronger the...
Science Buddies
Science Buddies: Do Hurricanes Cool the Ocean?
If you've ever so much as watched a news clip about a hurricane, you probably know that hurricanes draw their power from warm ocean waters. If that is true, does it mean that hurricanes actually cool the ocean down when they pass...
Science Education Resource Center at Carleton College
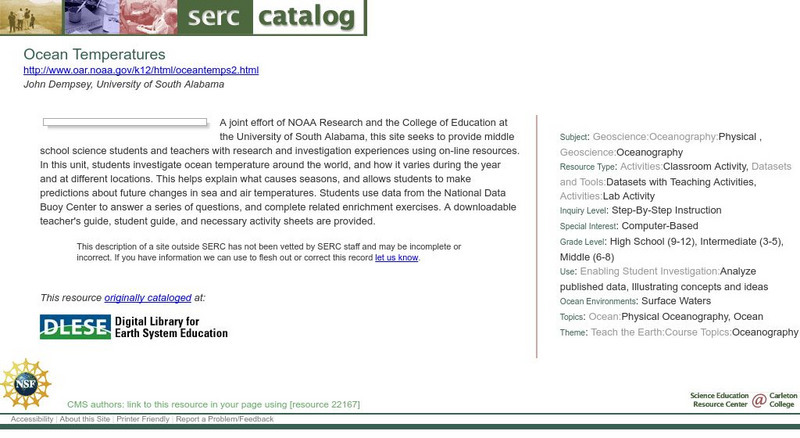
Serc: Ocean Temperature
A unit where learners explore the seasons by researching the change in ocean temperature at different times of the year and different locations. Lesson includes teacher guide and student worksheets.
NOAA
Noaa: National Weather Service: Jetstream: The Ocean
Online school for weather presents a complete guide to the ocean and its effect on our weather such as El Nino, hurricanes, floods, and droughts. Explores layers of the ocean, sea water, waves, tides, rip currents, and more. A review...
NASA
Nasa: El Nino
A concise explanation of El Nino. Discusses global wind patterns and ocean temperatures. Offers interactive weather-related learning activities.
Smithsonian Institution
National Museum of Natural History: Ocean Planet
Detailed website that was a companion to a 1995 traveling exhibit of the Smithsonian. Links to lesson plans and other educational materials are at the bottom of the page. Enter the exhibition to explore the world of the ocean.
NASA
Nasa Earth Observatory: Global Maps: Sea Surface Temperature
This global map from NASA's Earth Observatory shows the sea surface temperature from July 2002 to October 2008. Learn the influences that sea surface temperature has on climate and weather.
Woods Hole Oceanographic Institution
Woods Hole Oceanography Institute: Deep Ocean Circulation
What causes the circulation of ocean waters that are too deep to be affected by wind? Find out how salinity and temperature drive the deep sea currents. This resource has several videos and an online quiz.
Science Education Resource Center at Carleton College
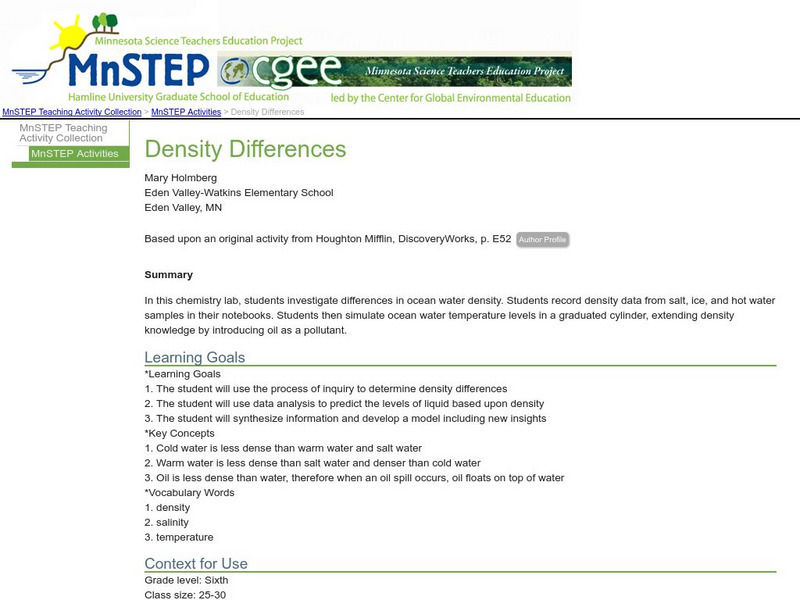
Serc: Density Differences
Students investigate differences in ocean water density, and record density data from salt, ice, and hot water samples in their notebooks. Students then simulate ocean water temperature levels in a simulation.
Science Education Resource Center at Carleton College
Serc: Detecting El Nino in Sea Surface Temperature Data
Through data analysis and observations of patterns, students learn about normal seasonal sea surface temperature variation as well as extreme variation, as in the case of El Nino and La Nina events, in the equatorial Pacific Ocean.
Science Education Resource Center at Carleton College
Serc: How Does the Temperature of the Great Lakes Change Over Time?
This activity allows students to use water surface temperature, bathymetric data, and weather data to look at trends in the water temperature of the Great Lakes.
Climate Literacy
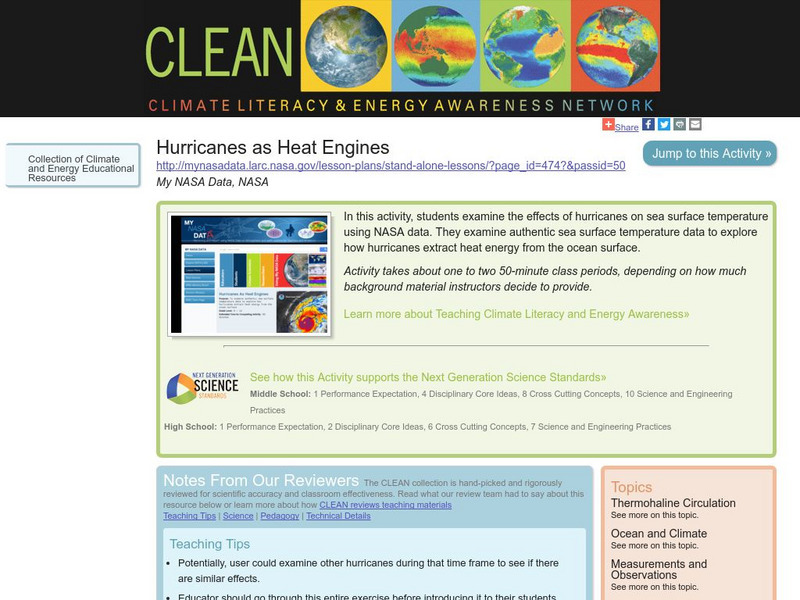
Clean: Hurricanes as Heat Engines
In this activity, students examine the effects of hurricanes on sea surface temperature using NASA data. They examine authentic sea surface temperature data to explore how hurricanes extract heat energy from the ocean surface.
Other
Rutgers Marine & Coastal Sciences: Cool Classroom
Students and teachers can explore the work of marine scientists and observe the ocean from their computers. Learn about Rutgers Coastal Ocean Observation Laboratory, discover why oceanography is important, and see what life is like in...
Rice University
Rice University: Museums Teaching Planet Earth: What Is the Hydrosphere?
Focus is on the hydrosphere and contains the definition as well as characteristics of the ocean and the effect of the ocean on climate.
PBS
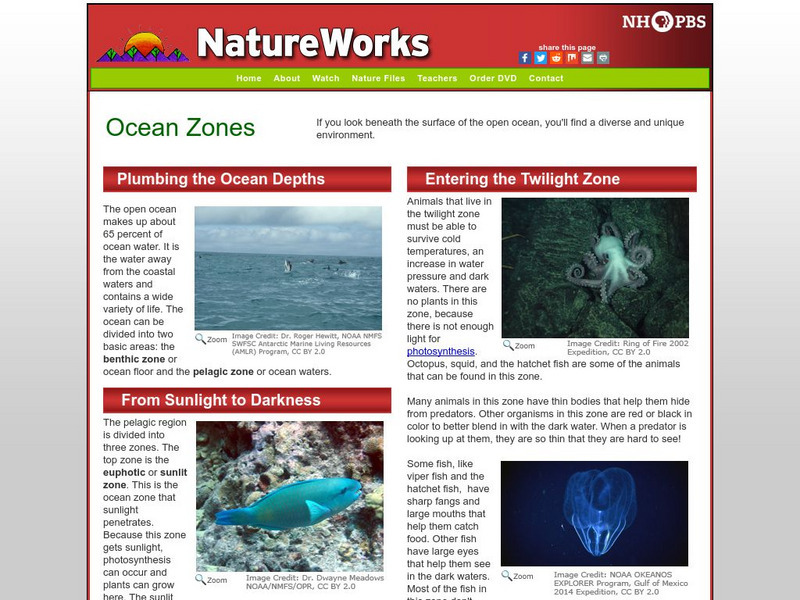
Nh Pbs: Nature Works: Ocean Zones
Discover more about the underocean environment at this site that surveys animals, environmental factors such as light and temperature, currents, animals, plants, and the like.
Scholastic
Scholastic: Study Jams! Science: Earth's Oceans
Oceans contain 97% of the water on the Earth and are home to a huge number of living creatures. View an informative slideshow of the ocean and its inhabitants and then test yourself on what you learned.


