Hi, what do you want to do?
Imagine Learning Classroom
Learn Zillion: Lesson Video for 'Understand the Least Squares Regression Line'
In this lesson, you will learn the importance of the least squares regression line by comparing residuals. [7:10]
Virtual Nerd
Virtual Nerd: What's a Scatter Plot?
Watch this tutorial to take a look at the scatter plot which is useful for graphically showing a bunch of data. [1:17]
Virtual Nerd
Virtual Nerd: How Do You Use a Scatter Plot to Find a Line of Fit?
A line-of-fit is a line that summarizes the trend in a set of data. In this tutorial, you'll see how to graph data on a coordinate plane and draw a line-of-fit for that data. [1:12]
Imagine Learning Classroom
Learn Zillion: Understand Correlation in Terms of the Strength of a Relationship
In this lesson, you will learn how to determine the strength of a relationship by investigating correlation. [3:48]
Imagine Learning Classroom
Learn Zillion: Write an Equation for Line of Best Fit
In this video, you will learn how to write an equation for a line of best fit by identifying the y-intercept and slope. [5:08]
Khan Academy
Khan Academy: Algebra: Fitting a Line to Data
This video utilizes Microsoft Excel to demonstrate how to plot data in the form of a scatter plot and then create a line of best fit. It also shows how to make a prediction based on the linear progression of the data. The software does...
Khan Academy
Khan Academy: Equation of a Line: Fitting a Line to Data
This video utilizes Microsoft Excel to demonstrate how to plot data in the form of a scatter plot and then create a line of best fit.
Loyola University Chicago
Math Flix: Graphs: Scatter Plot Creating
This QuickTime movie provides an opportunity to create a graph that is a scatter plot. A pdf worksheet is available by clicking on the hyperlink at the bottom of the page. As you watch and listen to the teacher and student interact it...
Sophia Learning
Sophia: Scatter Plots: Lesson 1
This lesson introduces scatter plots. It is 1 of 9 in the series titled "Scatter Plots."
Sophia Learning
Sophia: Scatter Plots: Lesson 6
This lesson introduces scatter plots as a method for presenting data. This is the first in a series of lessons about scatter plots and their uses. It is 6 of 9 in the series titled "Scatter Plots."
Sophia Learning
Sophia: Scatter Plots: Lesson 8
This lesson introduces scatter plots as a method for presenting data. This is the first in a series of lessons about scatter plots and their uses. It is 8 of 9 in the series titled "Scatter Plots."
Sophia Learning
Sophia: Scatter Plots: Lesson 9
This lesson introduces scatter plots as a method for presenting data. This is the first in a series of lessons about scatter plots and their uses. It is 9 of 9 in the series titled "Scatter Plots."
Sophia Learning
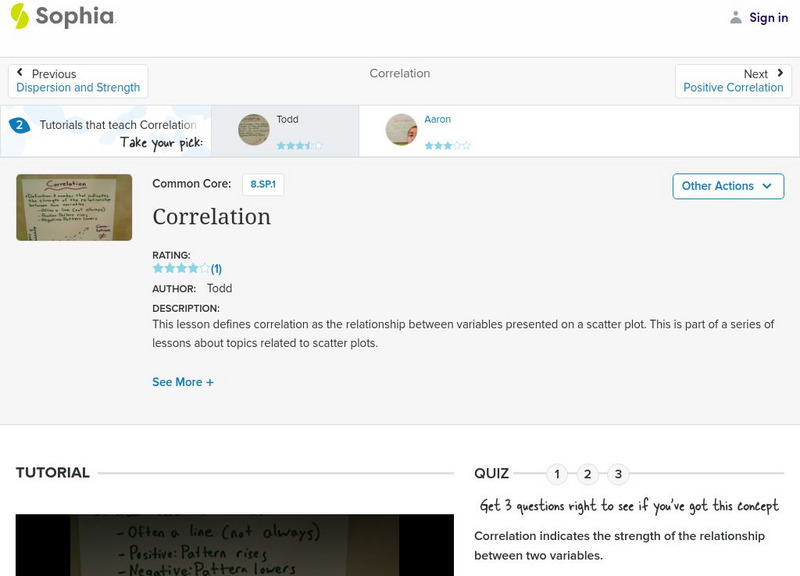
Sophia: Correlation
This lesson defines correlation as the relationship between variables presented on a scatter plot.
Sophia Learning
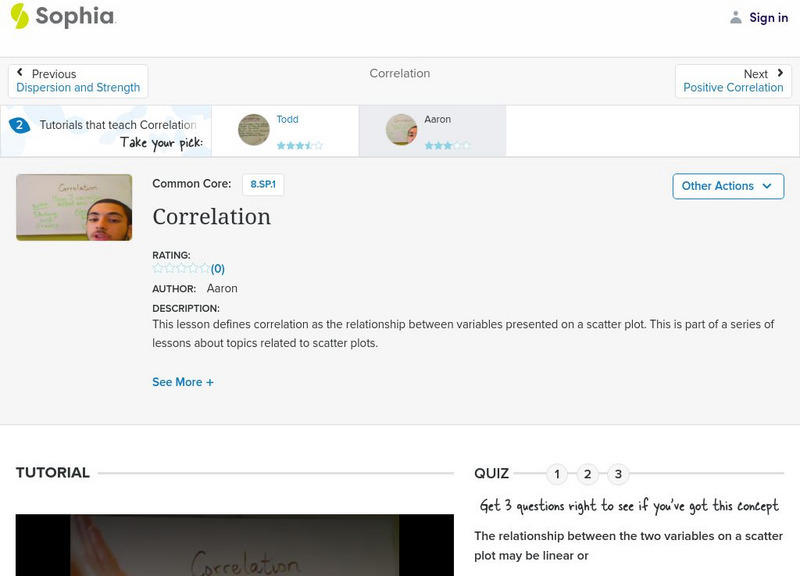
Sophia: Correlation
This lesson defines correlation as the relationship between variables presented on a scatter plot.
Sophia Learning
Sophia: Correlation: Lesson 2
This lesson defines correlation as the relationship between variables presented on a scatter plot. This is part of a series of lessons about topics related to scatter plots. It is 2 of 9 in the series titled "Correlation.' [3:31]
Sophia Learning
Sophia: Correlation: Lesson 3
This lesson defines correlation as the relationship between variables presented on a scatter plot. This is part of a series of lessons about topics related to scatter plots. It is 3 of 9 in the series titled "Correlation." [2:04]
Sophia Learning
Sophia: Correlation: Lesson 7
This lesson will introduce correlation and correlation coefficient. It is 7 of 9 in the series titled "Correlation." [9:59]
Sophia Learning
Sophia: Correlation: Lesson 8
This lesson will introduce correlation and correlation coefficient. It is 8 of 9 in the series titled "Correlation." [9:52]
Sophia Learning
Sophia: Correlation: Lesson 9
This lesson will introduce correlation and correlation coefficient. It is 9 of 9 in the series titled "Correlation." [9:00]
Sophia Learning
Sophia: Scatter Plots: Lesson 5
This lesson introduces scatter plots as a method for presenting data. This is the first in a series of lessons about scatter plots and their uses. It is 5 of 9 in the series titled "Scatter Plots."
Khan Academy
Khan Academy: Estimating the Line of Best Fit Exercise
Demonstrates how to find the line of best fit for a scatter plot. [1:17]
Bozeman Science
Bozeman Science: Graphing Data by Hand
Paul Andersen shows you how to graph data by hand. He explains the required elements of a scatter plot with a best fit line. He shows you how to properly scale and label the axes.
Bozeman Science
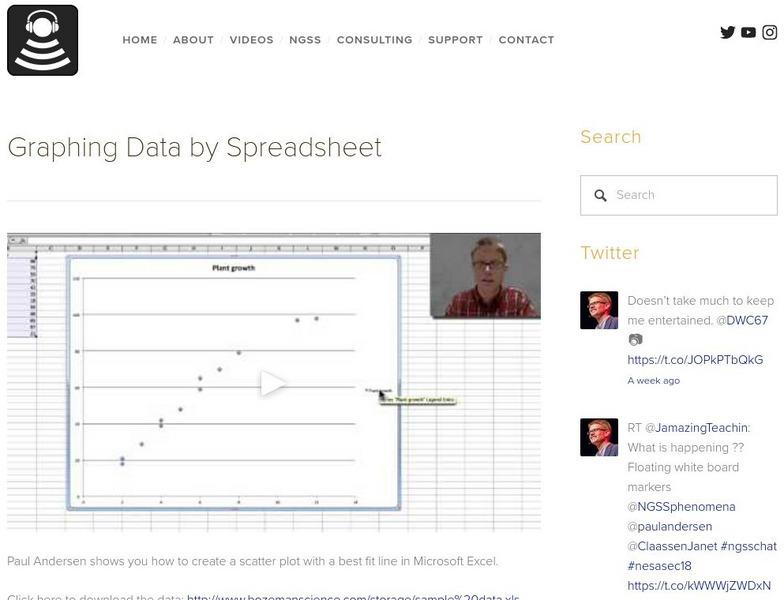
Bozeman Science: Graphing Data by Spreadsheet
Paul Andersen shows you how to create a scatter plot with a best fit line in Microsoft Excel. You can go here to download the data: http://www.bozemanscience.com/storage/sample%20data.xls
Sophia Learning
Sophia: Finding the Least Squares Line: Lesson 1
This lesson will demonstrate finding the least-squares line. It is 1 of 3 in the series titled "Finding the Least-squares Line." [7:13]


