Curated OER
Binomial Probability Distribution Section 5.4
In this Binomial Probability Distribution, students use the binomial probability formula to determine the success of a given probability. Using the given parameters, students write a probability equation and solve the problem. They...
Curated OER
Raisin the Statistical Roof
Use a box of raisins to help introduce the concept of data analysis. Learners collect, analyze and display their data using a variety of methods. The included worksheet takes them through a step-by-step analysis process and graphing.
Curated OER
The Race of Baseball All-Stars
Collect and analyze data. Pupils graph their data and model with it to solve real life problems. They use logic and deductive reasoning to draw conclusions.
Curated OER
Agricultural Statistician
High schoolers explore how statistics effect their daily lives. They discuss how statistical data is collected for the purposes of agriculture.
Curated OER
Measuring Crime and Fear of Crime
Have your learners delve into the realm of crime statistics using this resource. They use data to answer a series of questions about crime in Britain.
Curated OER
Problem Solving and the Sports Page
The use of box scores from baseball games is the foundation of this math lesson. Organize your class into groups of four, and give identical box scores from a baseball game that was just played. Have them create word problems from the...
Curated OER
Word Problems That Involve the Mean (II)
In this word problem worksheet, students examine real world problems. They compute the mean, median, and mode of given problems. This one-page worksheet contains 5 multi-step problems. Answers are provided.
Curated OER
Measures of Central Tendency
Students analyze data using central tendencies. In this statistics lesson, students collect and analyze data using the mean, median and mode. They create a power point representing the different measures of central tendency.
Curated OER
Jelly Bean Statistics
Learners develop a process of packing jelly beans efficiently. For this math lesson, students explain the quality control methods they designed. They construct histograms using Excel spreadsheet.
Curated OER
Measuring Dispersion
Students compute the standard deviation for a given set of data. For this measuring dispersion lesson, students compute the mean, and then the distance from the mean for each data point. They find the standard deviation of the data.
Curated OER
Recipe For Disaster
Students play an interactive game online to learn ratios. In this statistics lesson, students solve problems in an online game about ratio and relating statistics to the real world. This lesson provides hands on as well as teaching time.
Curated OER
Transforming Univariate Data
Learners analyze plotted data in this statistics lesson. They differentiate between skewed and normal data. They also explore and interconnect exponential growth and decay as it relates to the data.
Curated OER
Investigating Correlation
High schoolers investigate different types of correlation in this statistics instructional activity. They identify positive, negative and no correlation as it relates to their data. They then find the line of best fit for the plotted data.
Curated OER
Data Collection and Graphing
Students collect data and graph it on a coordinate plane and analyze it. In this statistics lesson, students display their data collection using a graph. They determine which central tendency will work best.
Curated OER
Probability and Expected Value
Students collect data and analyze it. In this statistics lesson, students make predictions using different outcomes of trials.
Curated OER
Venn Diagrams
Students collect and display data in a Venn Diagram. In this statistics lesson, students collect data, compare the data and make inferences about their data. They use the Venn diagrams to identify what the data have in common and how...
Curated OER
Probability Using M&M's
Students estimate and then count the number of each color of M&M's in their bag. In this mathematics lesson, students find the experimental probability of selecting each color from the bag. Students create pictographs and bar graphs...
Curated OER
Make a Pass at Me
Students identify different types of functions and units of measurements. In this statistics lesson plan, students will collect data, graph their data and make predictions about their data. They plot a linear regression graph.
Curated OER
Statistics with State Names
Students analyze the number of times each letter in the alphabet is used in the names of the states. In this statistics activity, students create a stem and leaf plot, box and whisker plot and a histogram to analyze their data.
Curated OER
Data Analysis: Infiltration Rate and Composition of Concrete
Students collect and graph data. In this statistics lesson, students analyze data using a spreadsheet program. They display their data effectively and analyze it.
Curated OER
Organizing Data
In this statistics worksheet, 11th graders collect data and organize it using a frequency table. They plot their data and analyze it using stem and leaf plots. There are 3 questions with an answer key.
Curated OER
Scatter Plots
In this statistics worksheet, 11th graders analyze different scatter plot graphs for positive, negative and no correlation. They graph their data and analyze it using scatter plots.There is 1 question with an answer key.
Curated OER
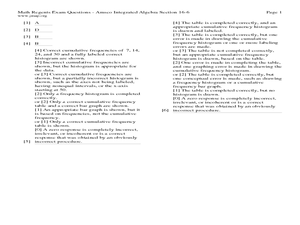
Quartiles, Percentiles, and Cumulative Frequency
In this statistics lesson, 11th graders are asked to calculate the percentiles, quartiles and cumulative frequency given different graphs and data. There are 6 questions with an answer key.
Curated OER
Infusing Equity Vs Gender into the Classroom
Students explore the effect of gender bias in the classroom. For this statistics lesson, students discuss the effects of stereotyping, discrimination, and gender bias in the classroom. They collect data on different work places dealing...


